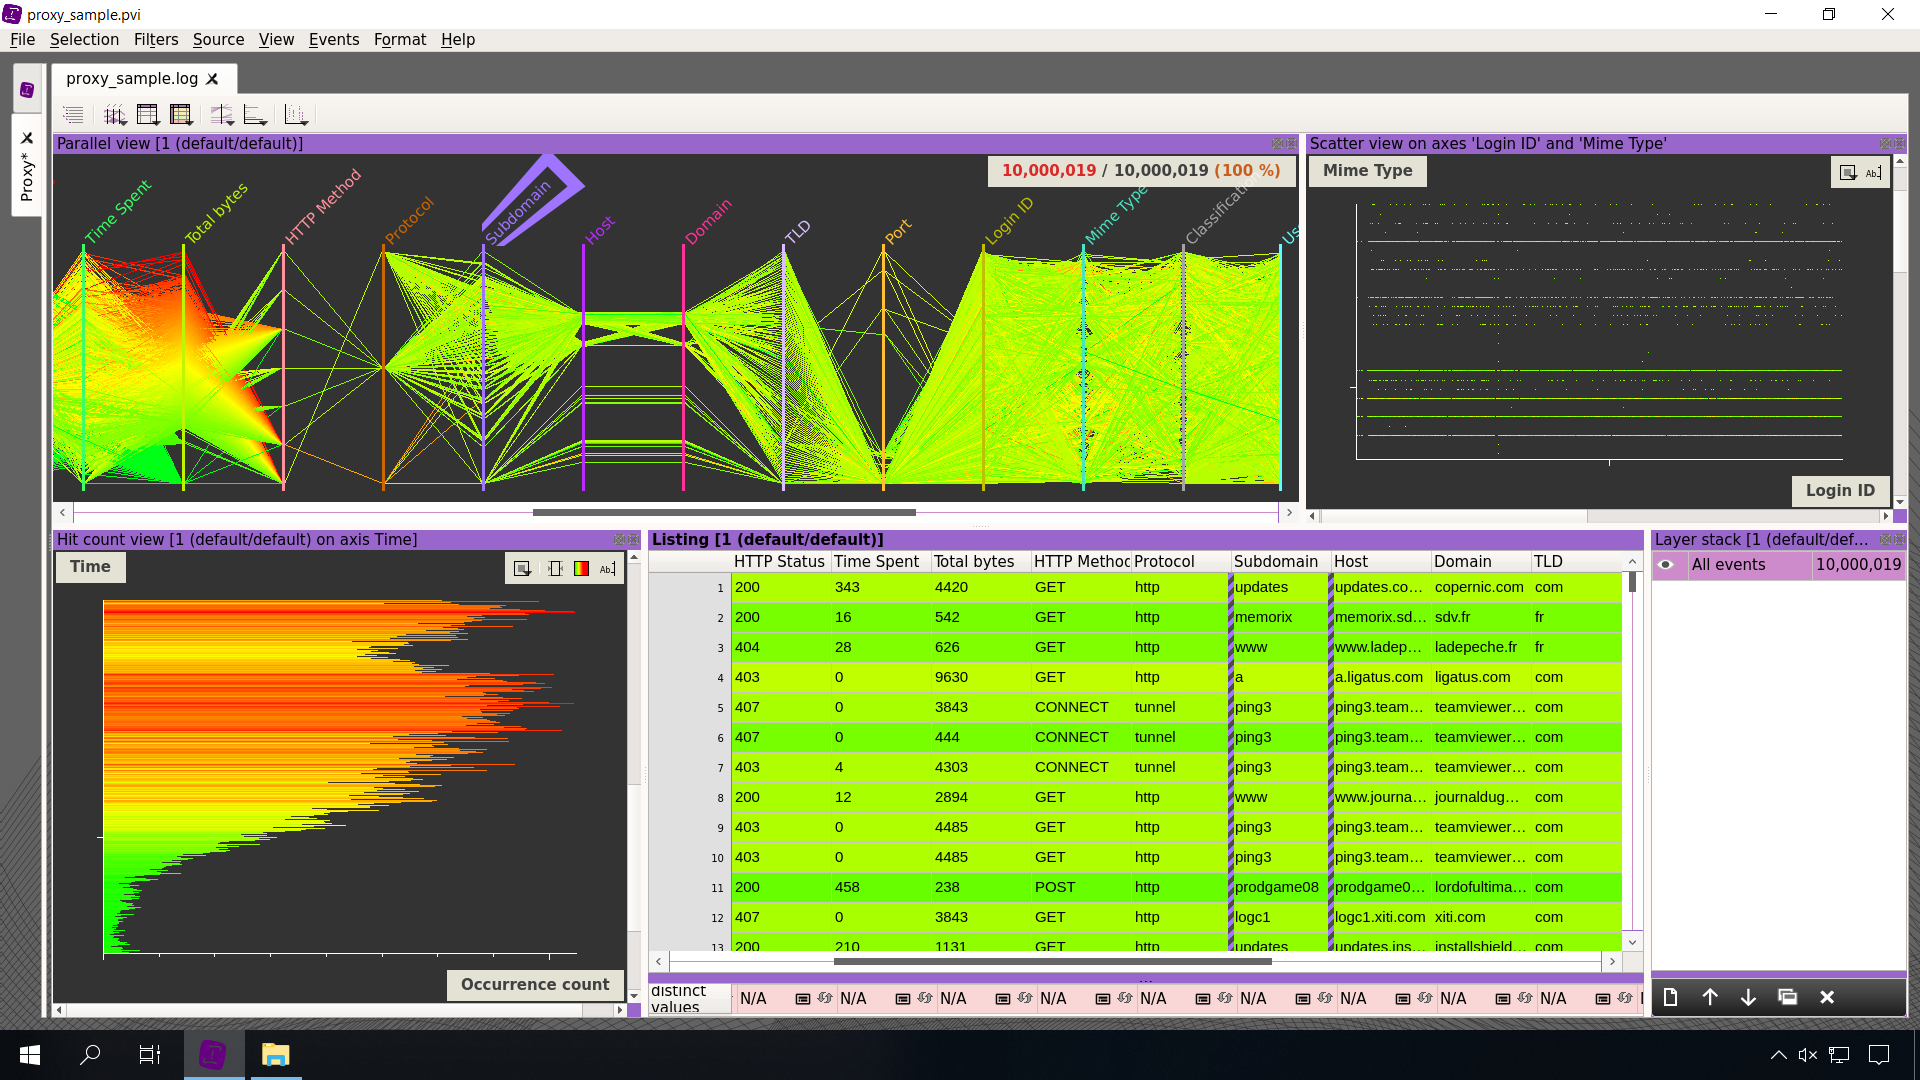
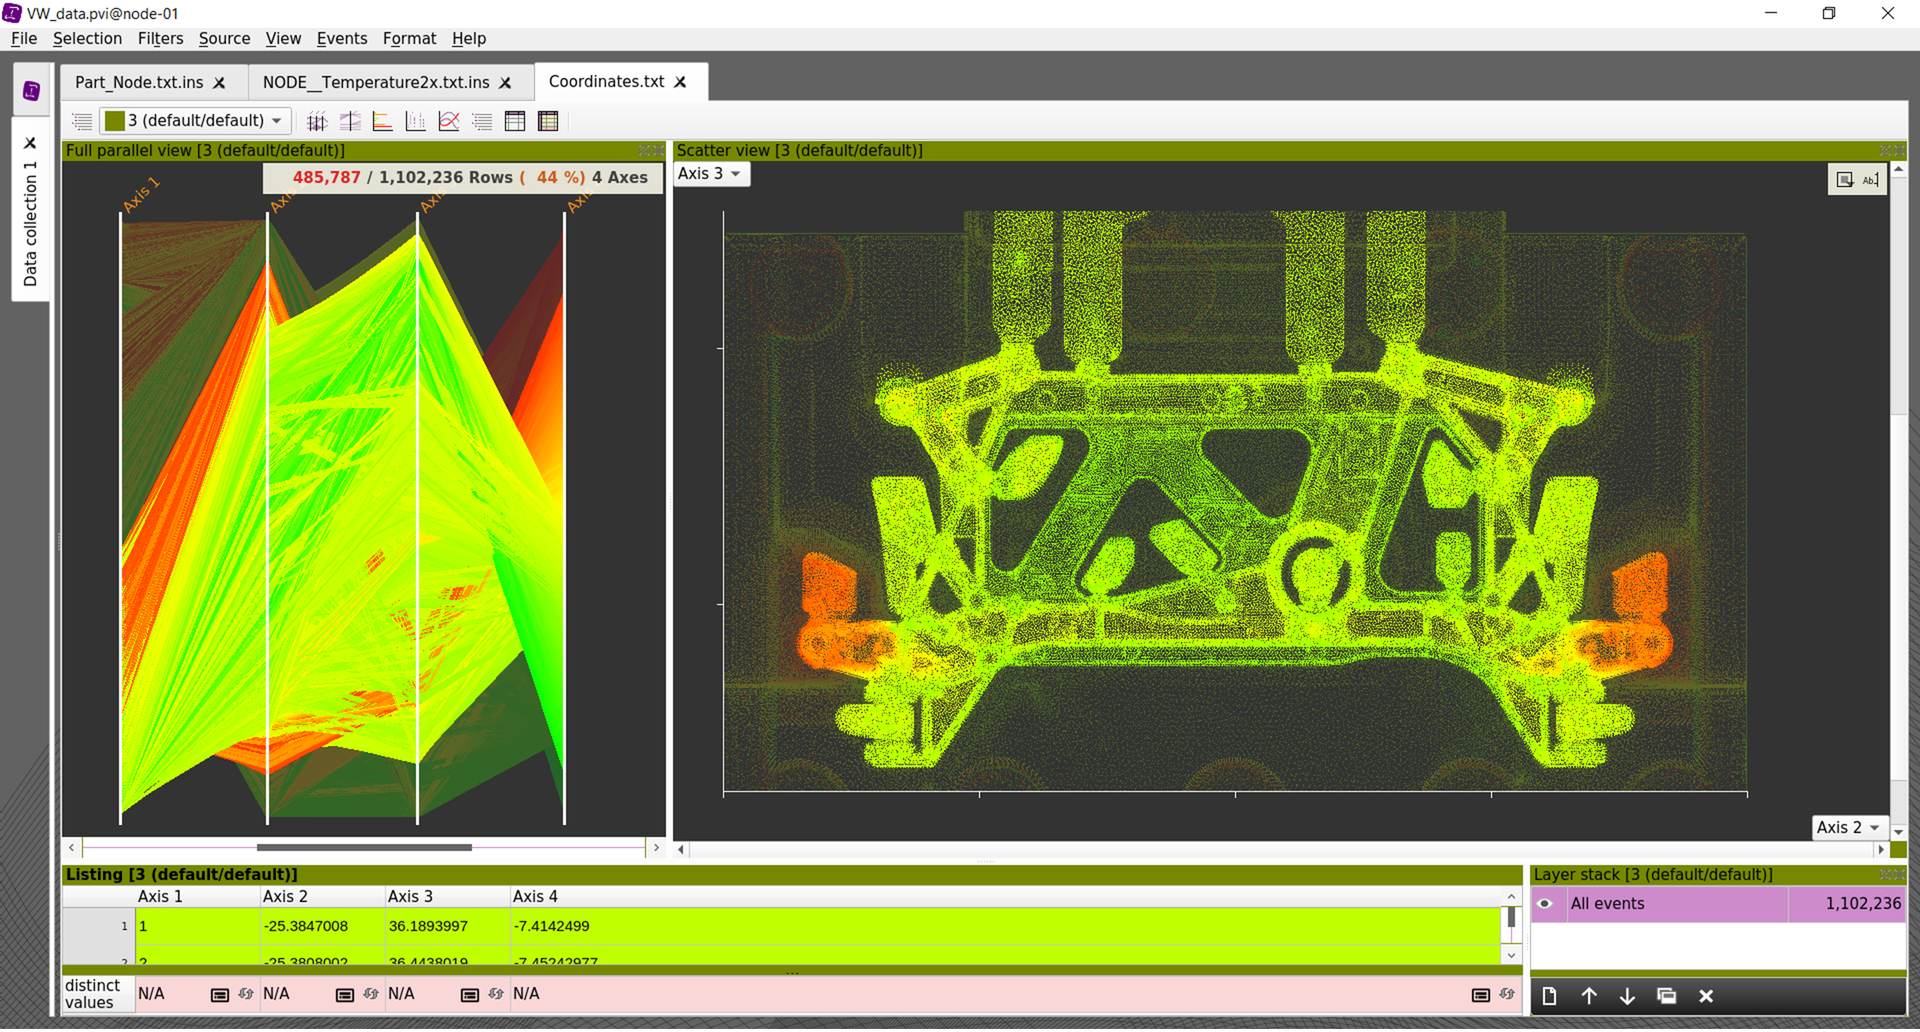
Visualize an unlimited number of columns, dynamically change axes mappings, apply color gradients, or instantly view density along the axes.
Visualize an unlimited number of columns, dynamically change axes mappings, apply color gradients, or instantly view density along the axes.
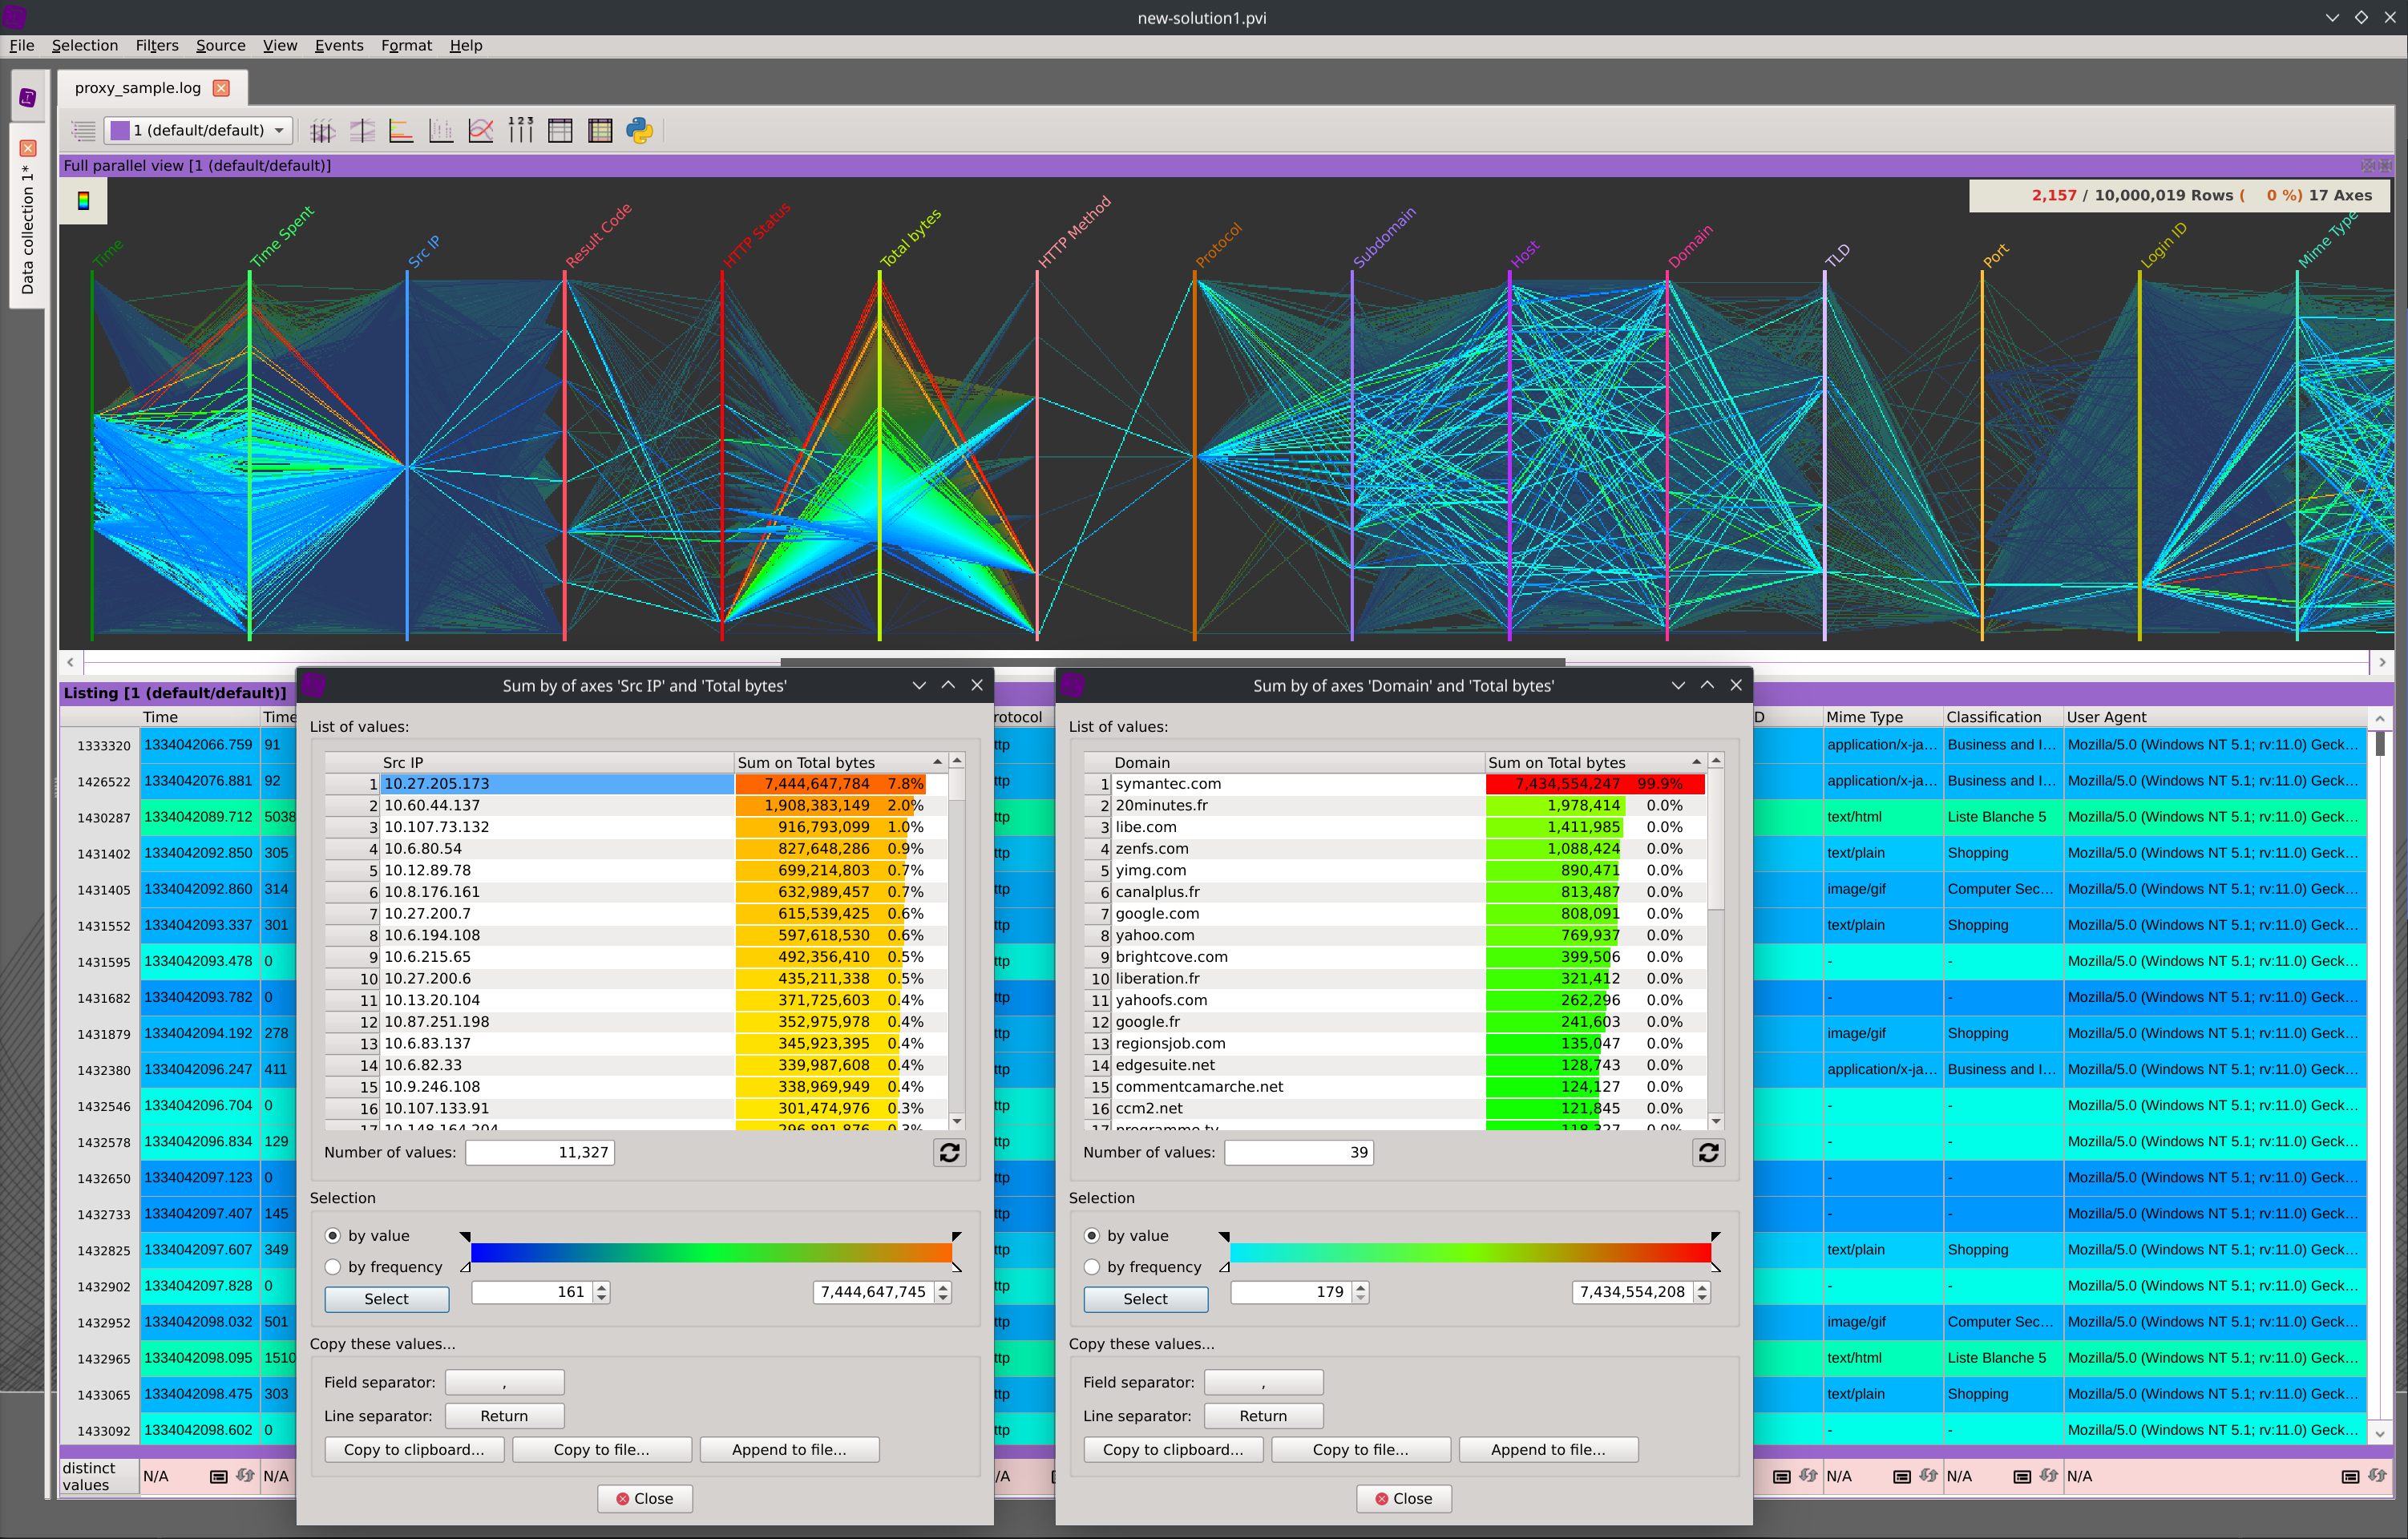
Analyze the distribution of values between two columns, zoom in until patterns emerge, and isolate outliers.
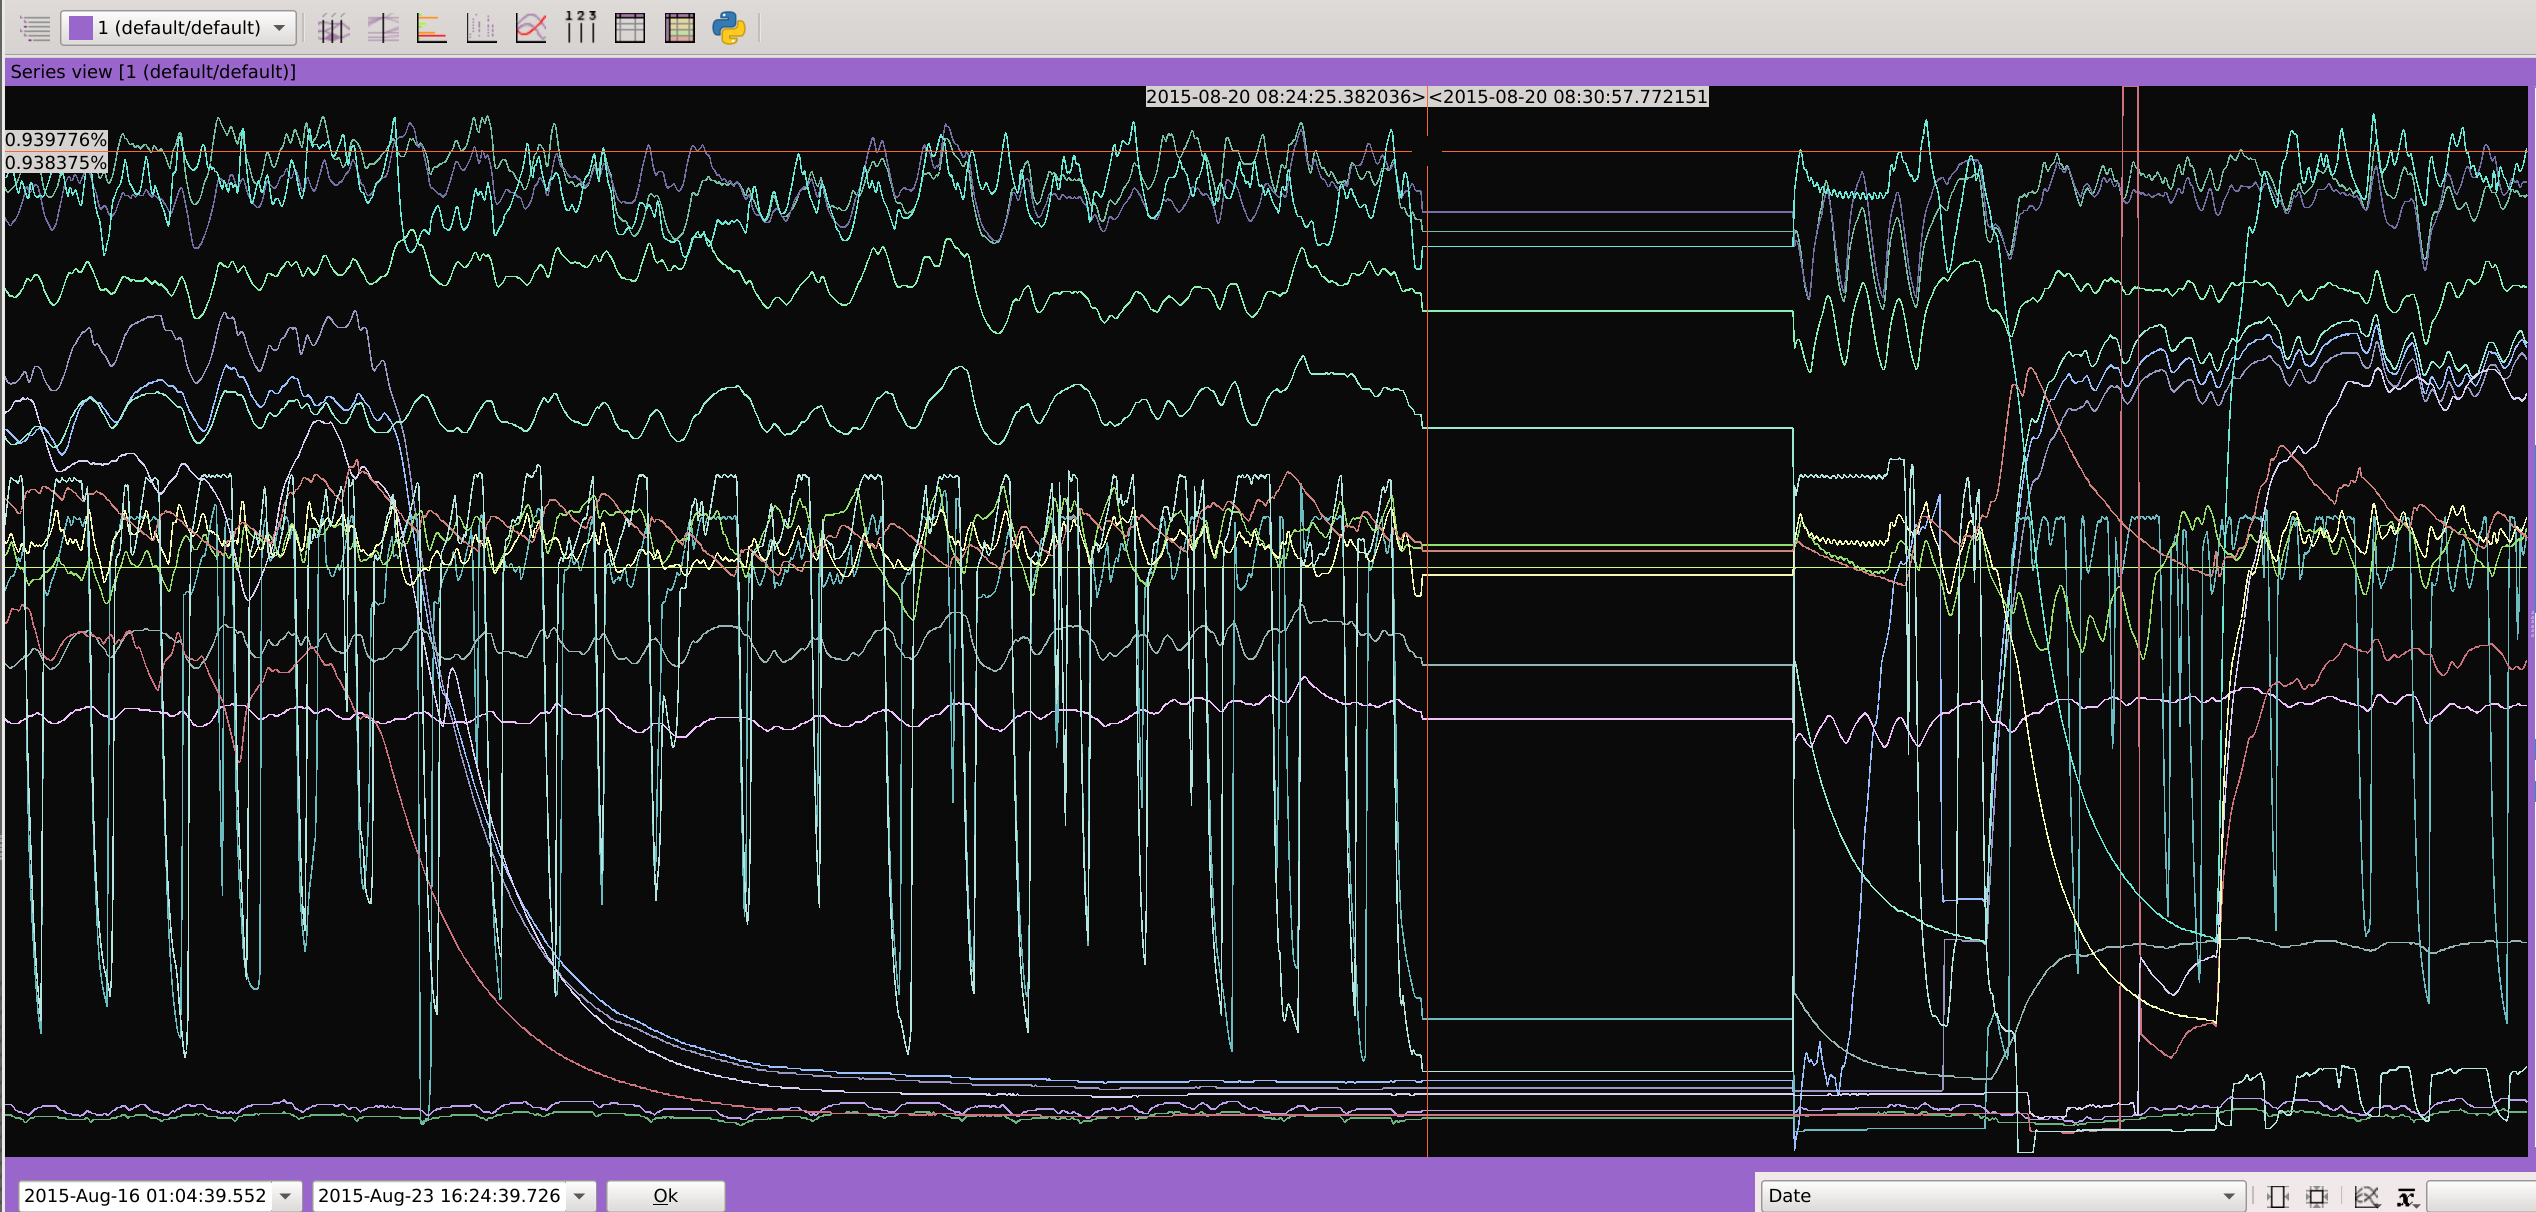
Visualize the progression of values sorted by a numeric variable, distribute them based on values within another column, hide specific ones, link points together, isolate ranges, or zoom in for closer examination.
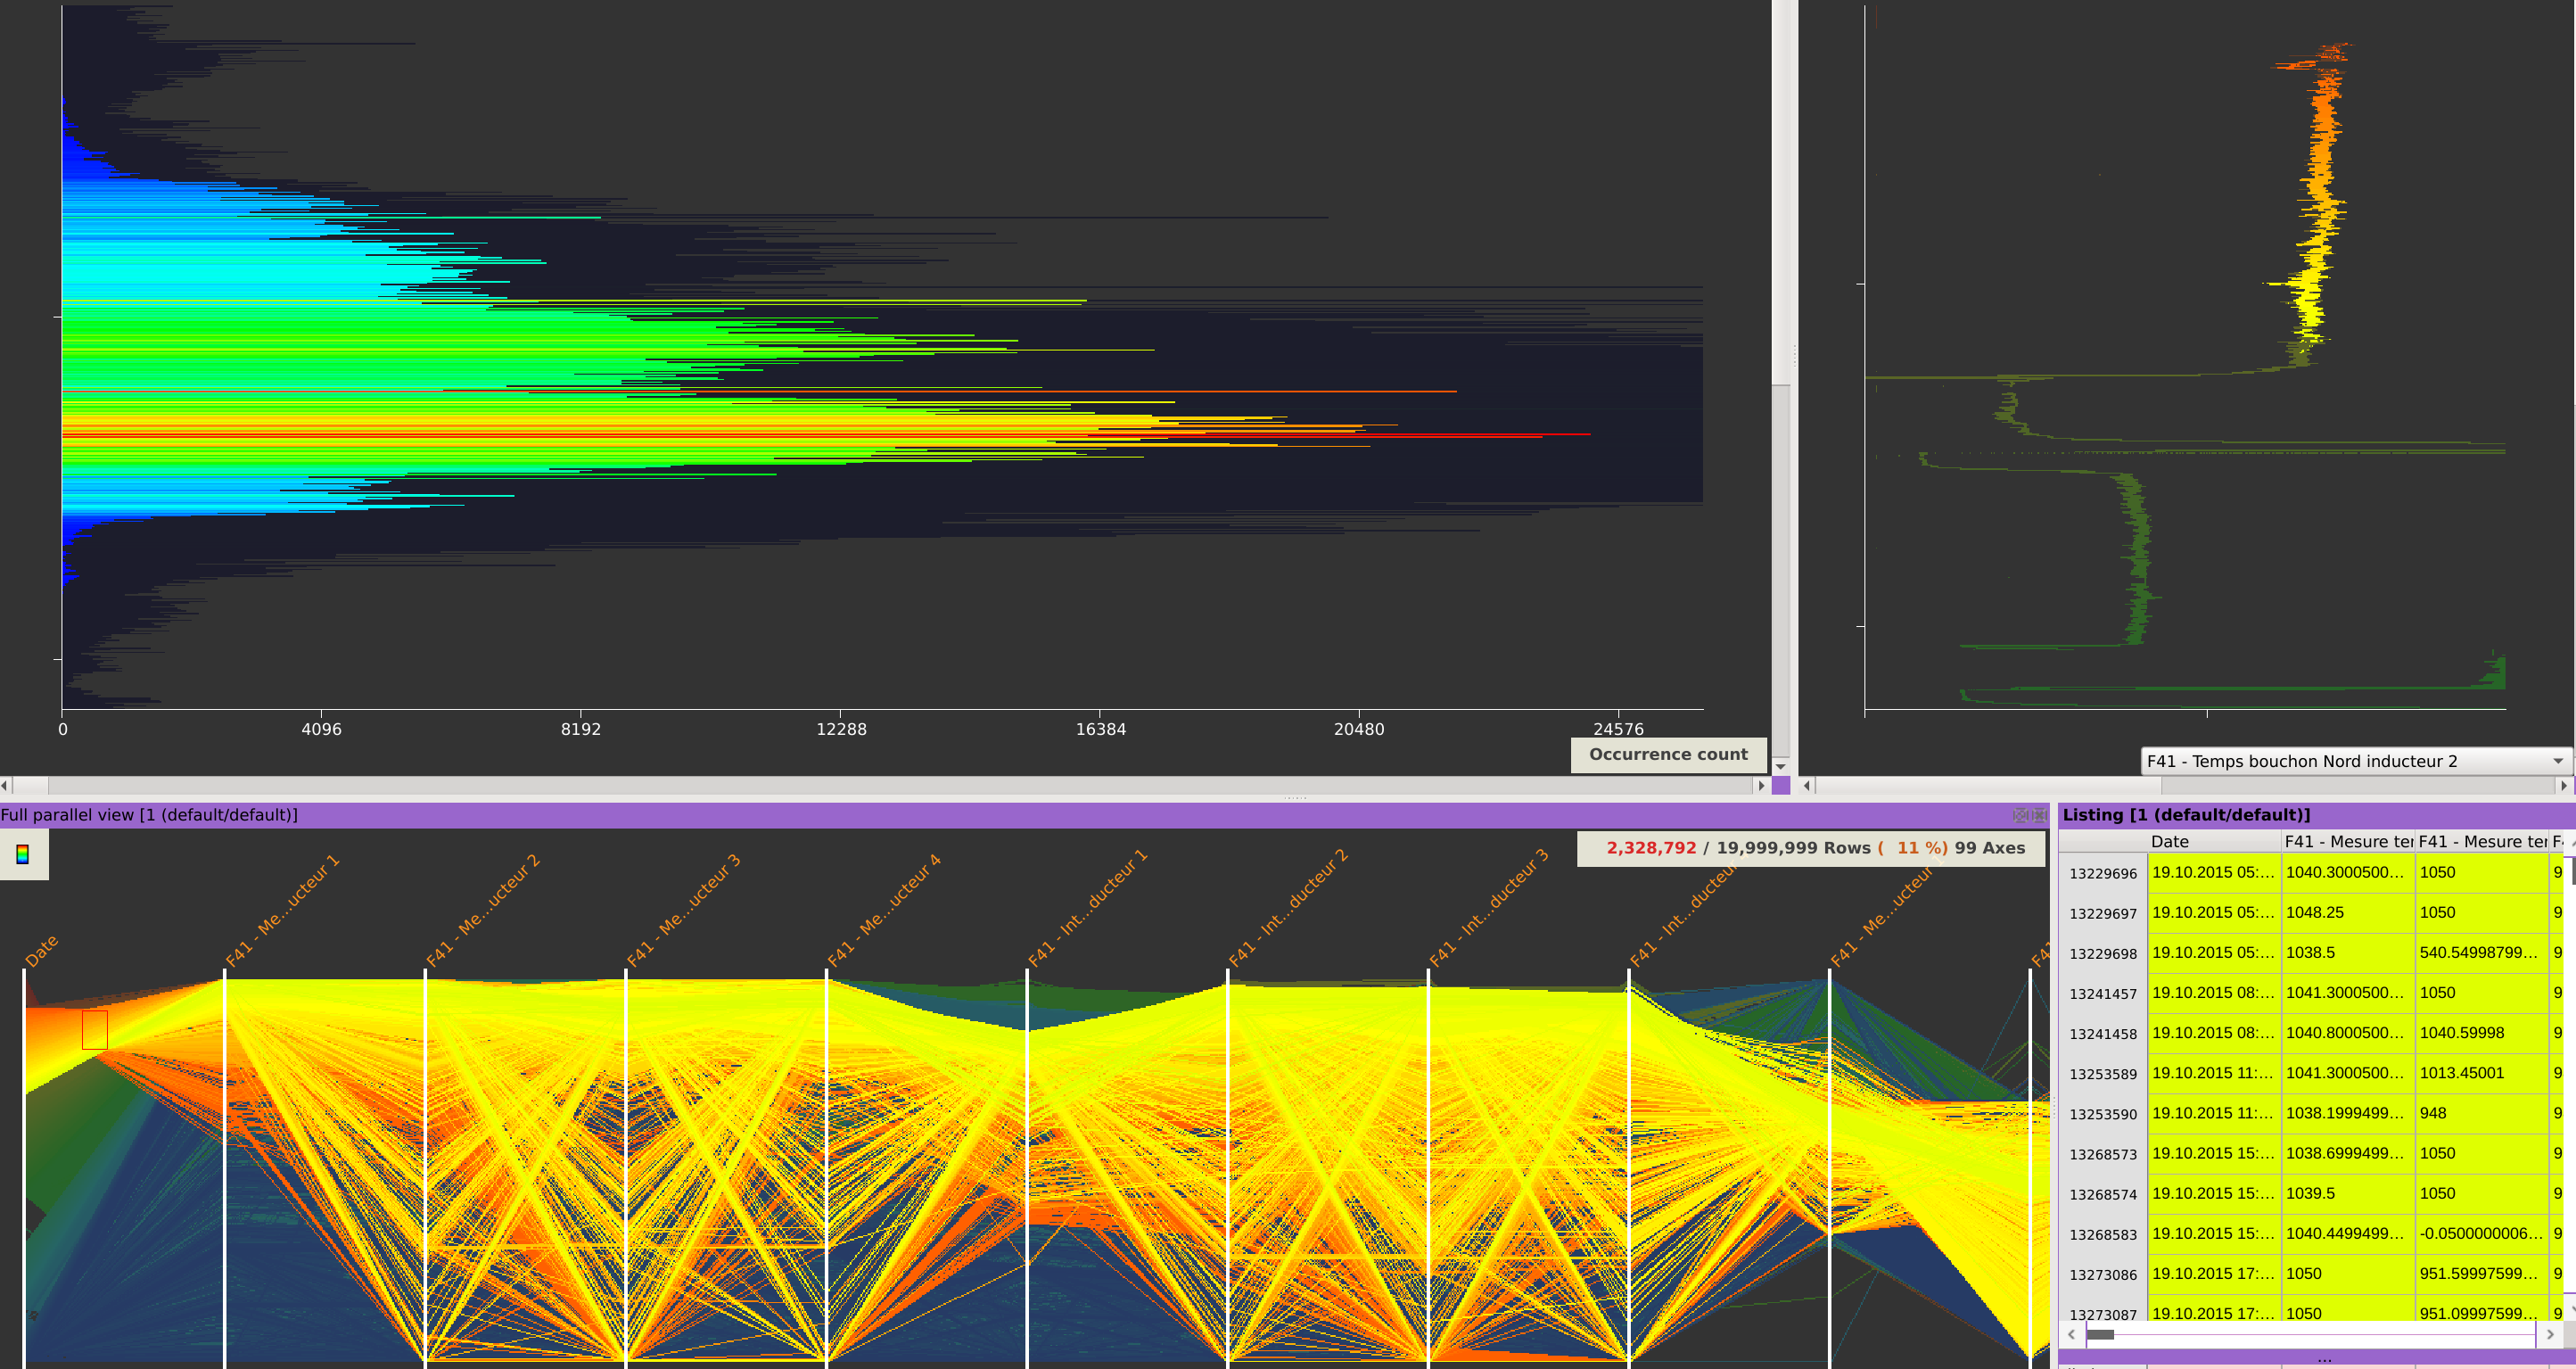
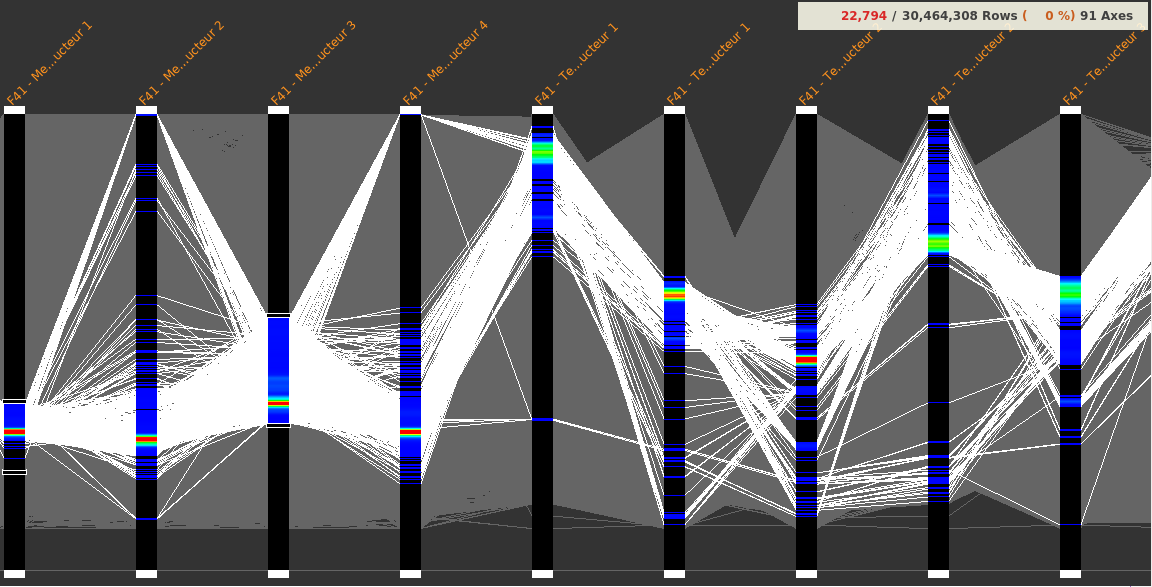
Inspect the density of events along a specific axis.
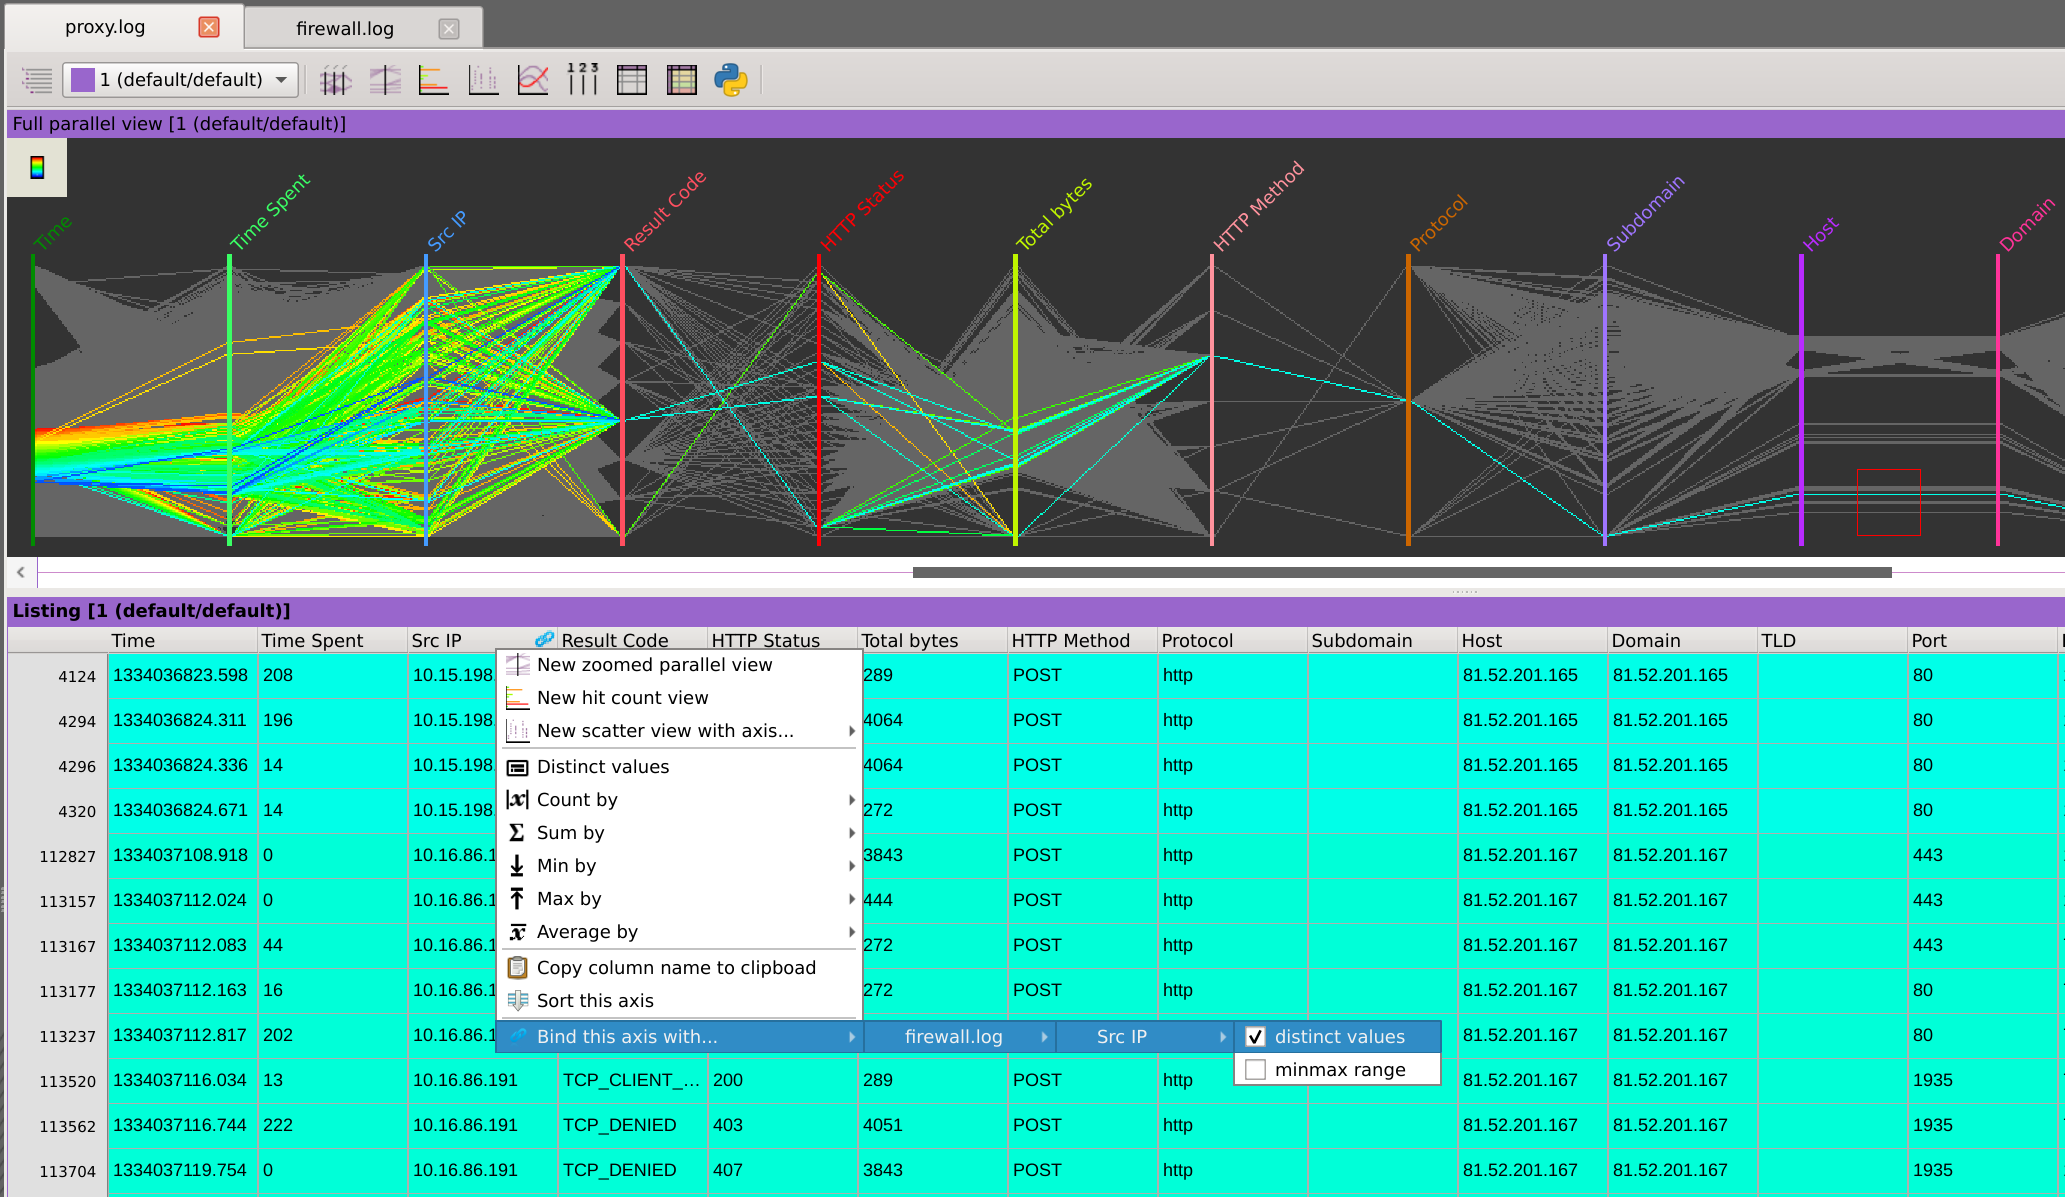
Compute statistical metrics for the selected data, aggregate values over a specific column, or filter rows.
Access raw data, sort columns, or perform advanced searches.
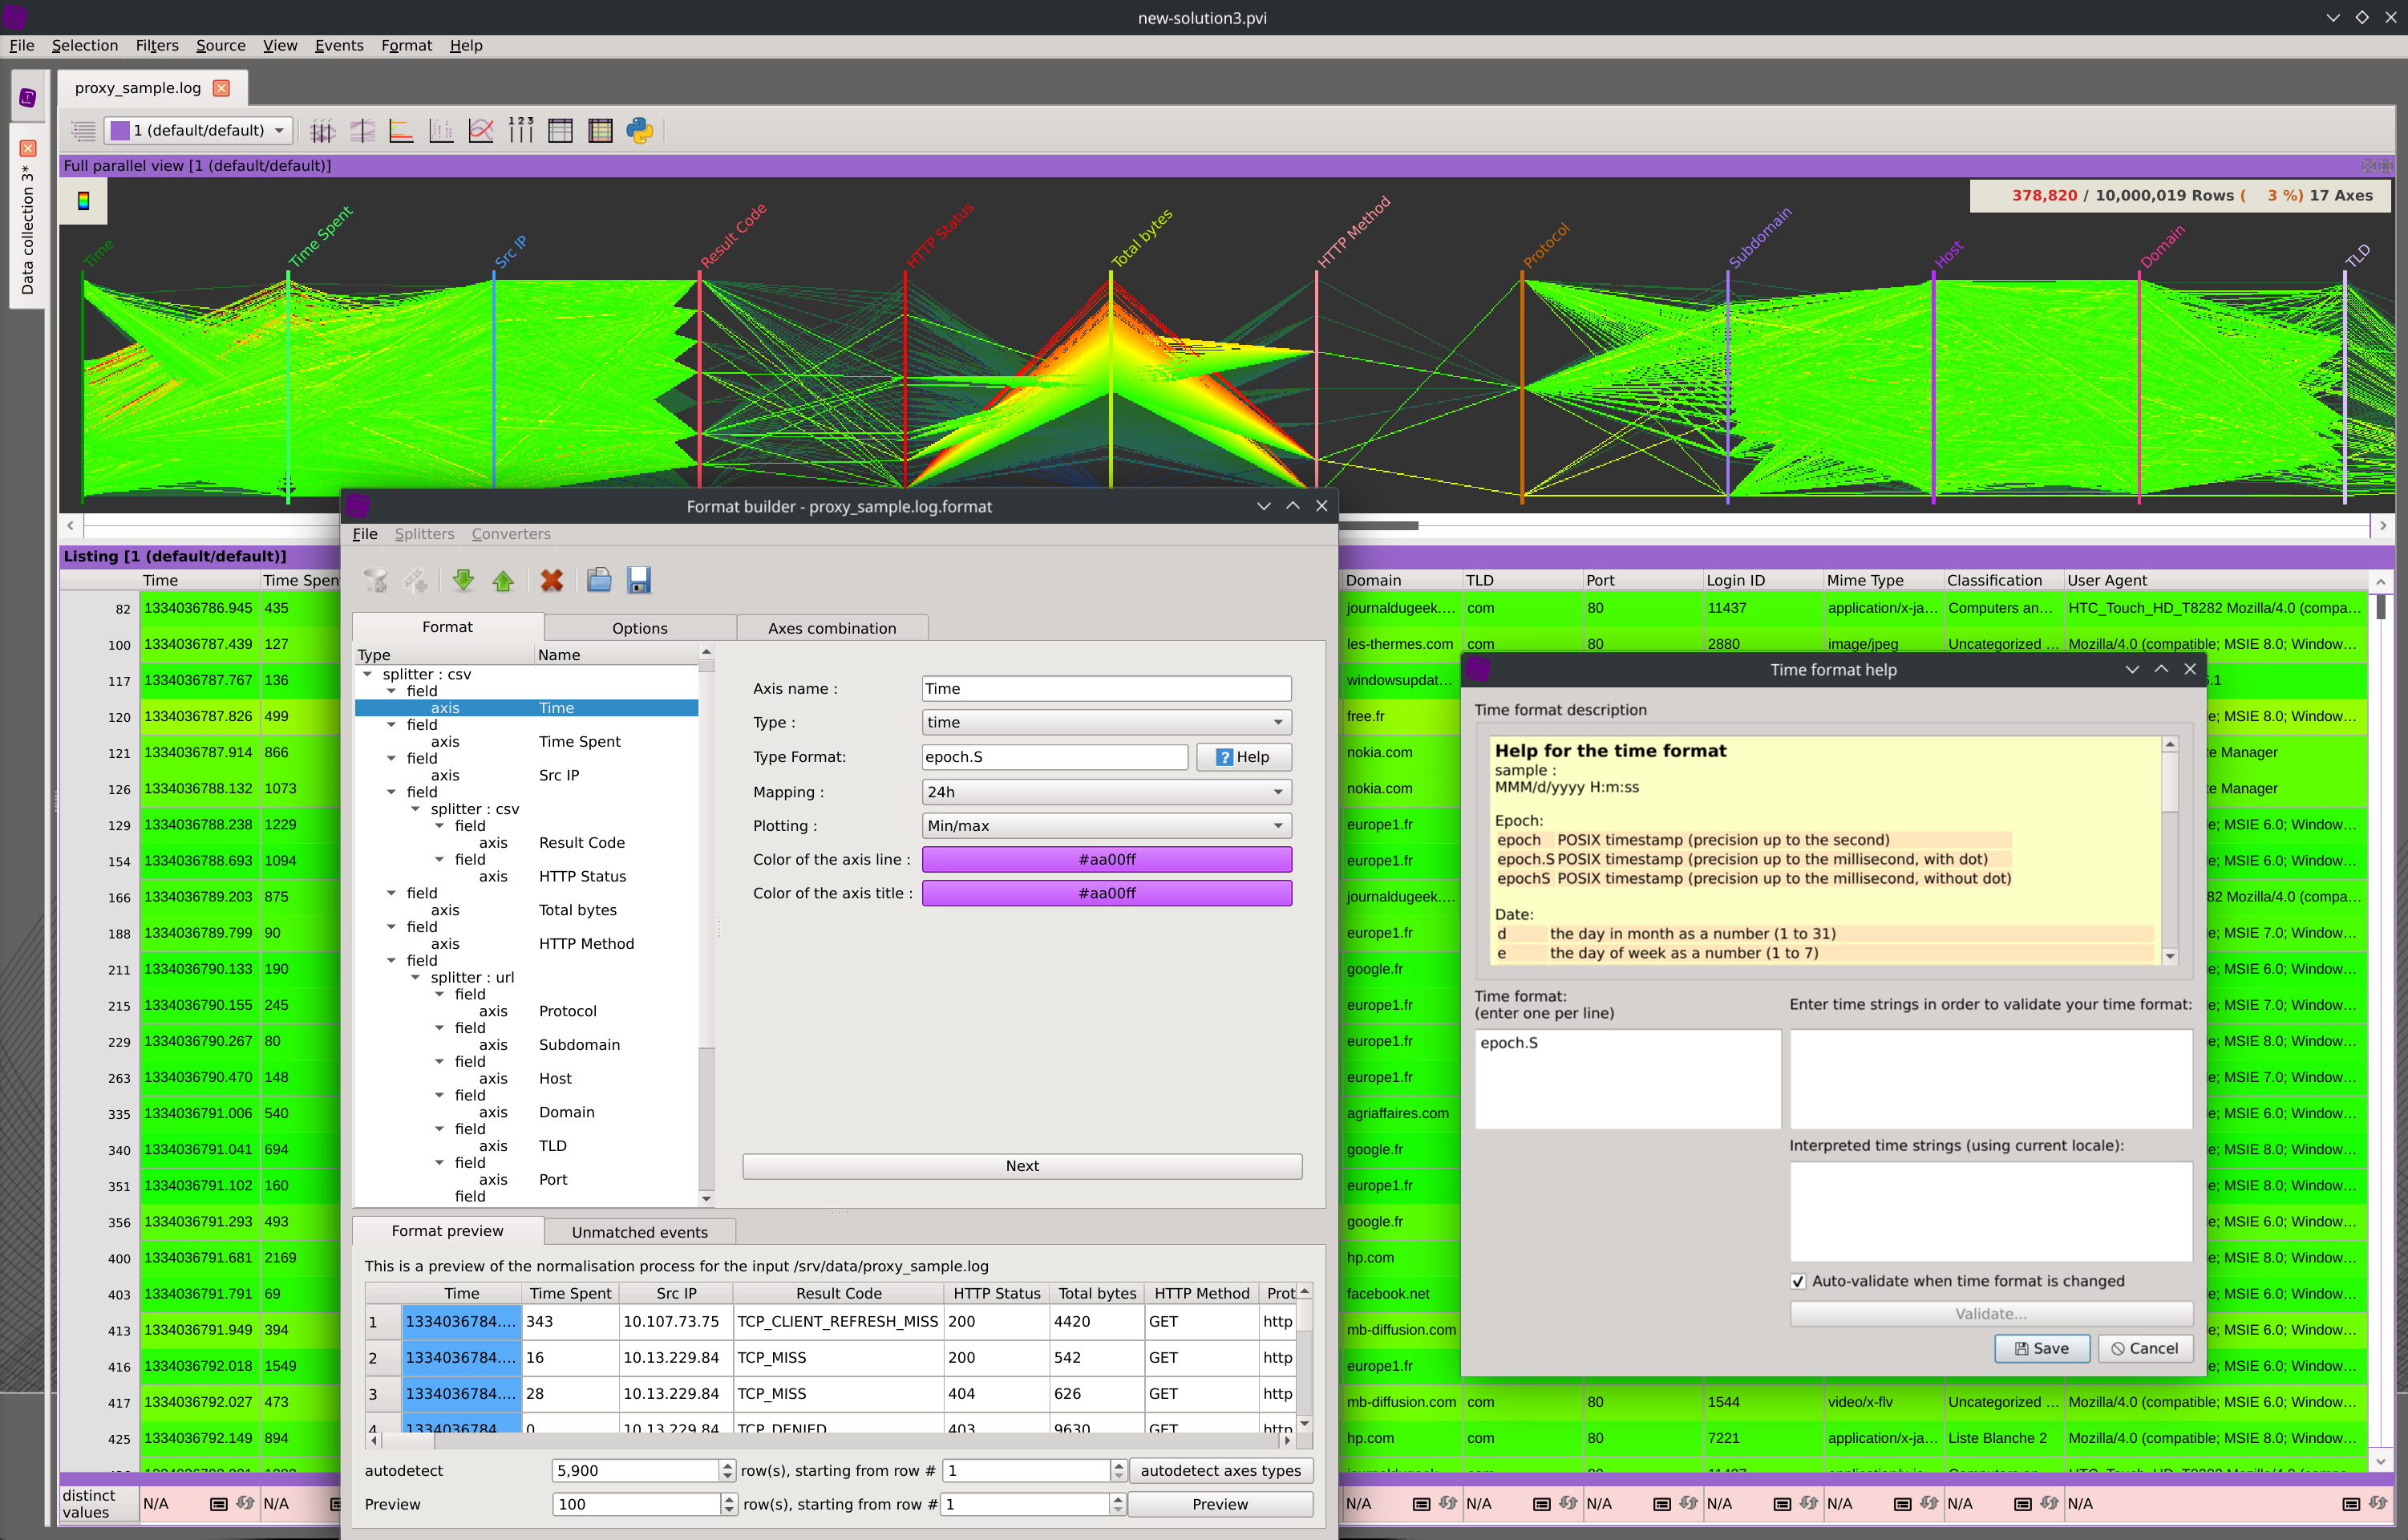
The data ingest stage will convert your datasets into columns optimized for realtime visualization and manipulations. Connect to any of the supported SQL database, load Parquet and PCAP files, or seamlessly import CSV files thanks to the columns name and type autodetection. Other types of structured text data can be transformed into meaningful columns by applying regular expressions or using any of the provided splitters and converters plugins.
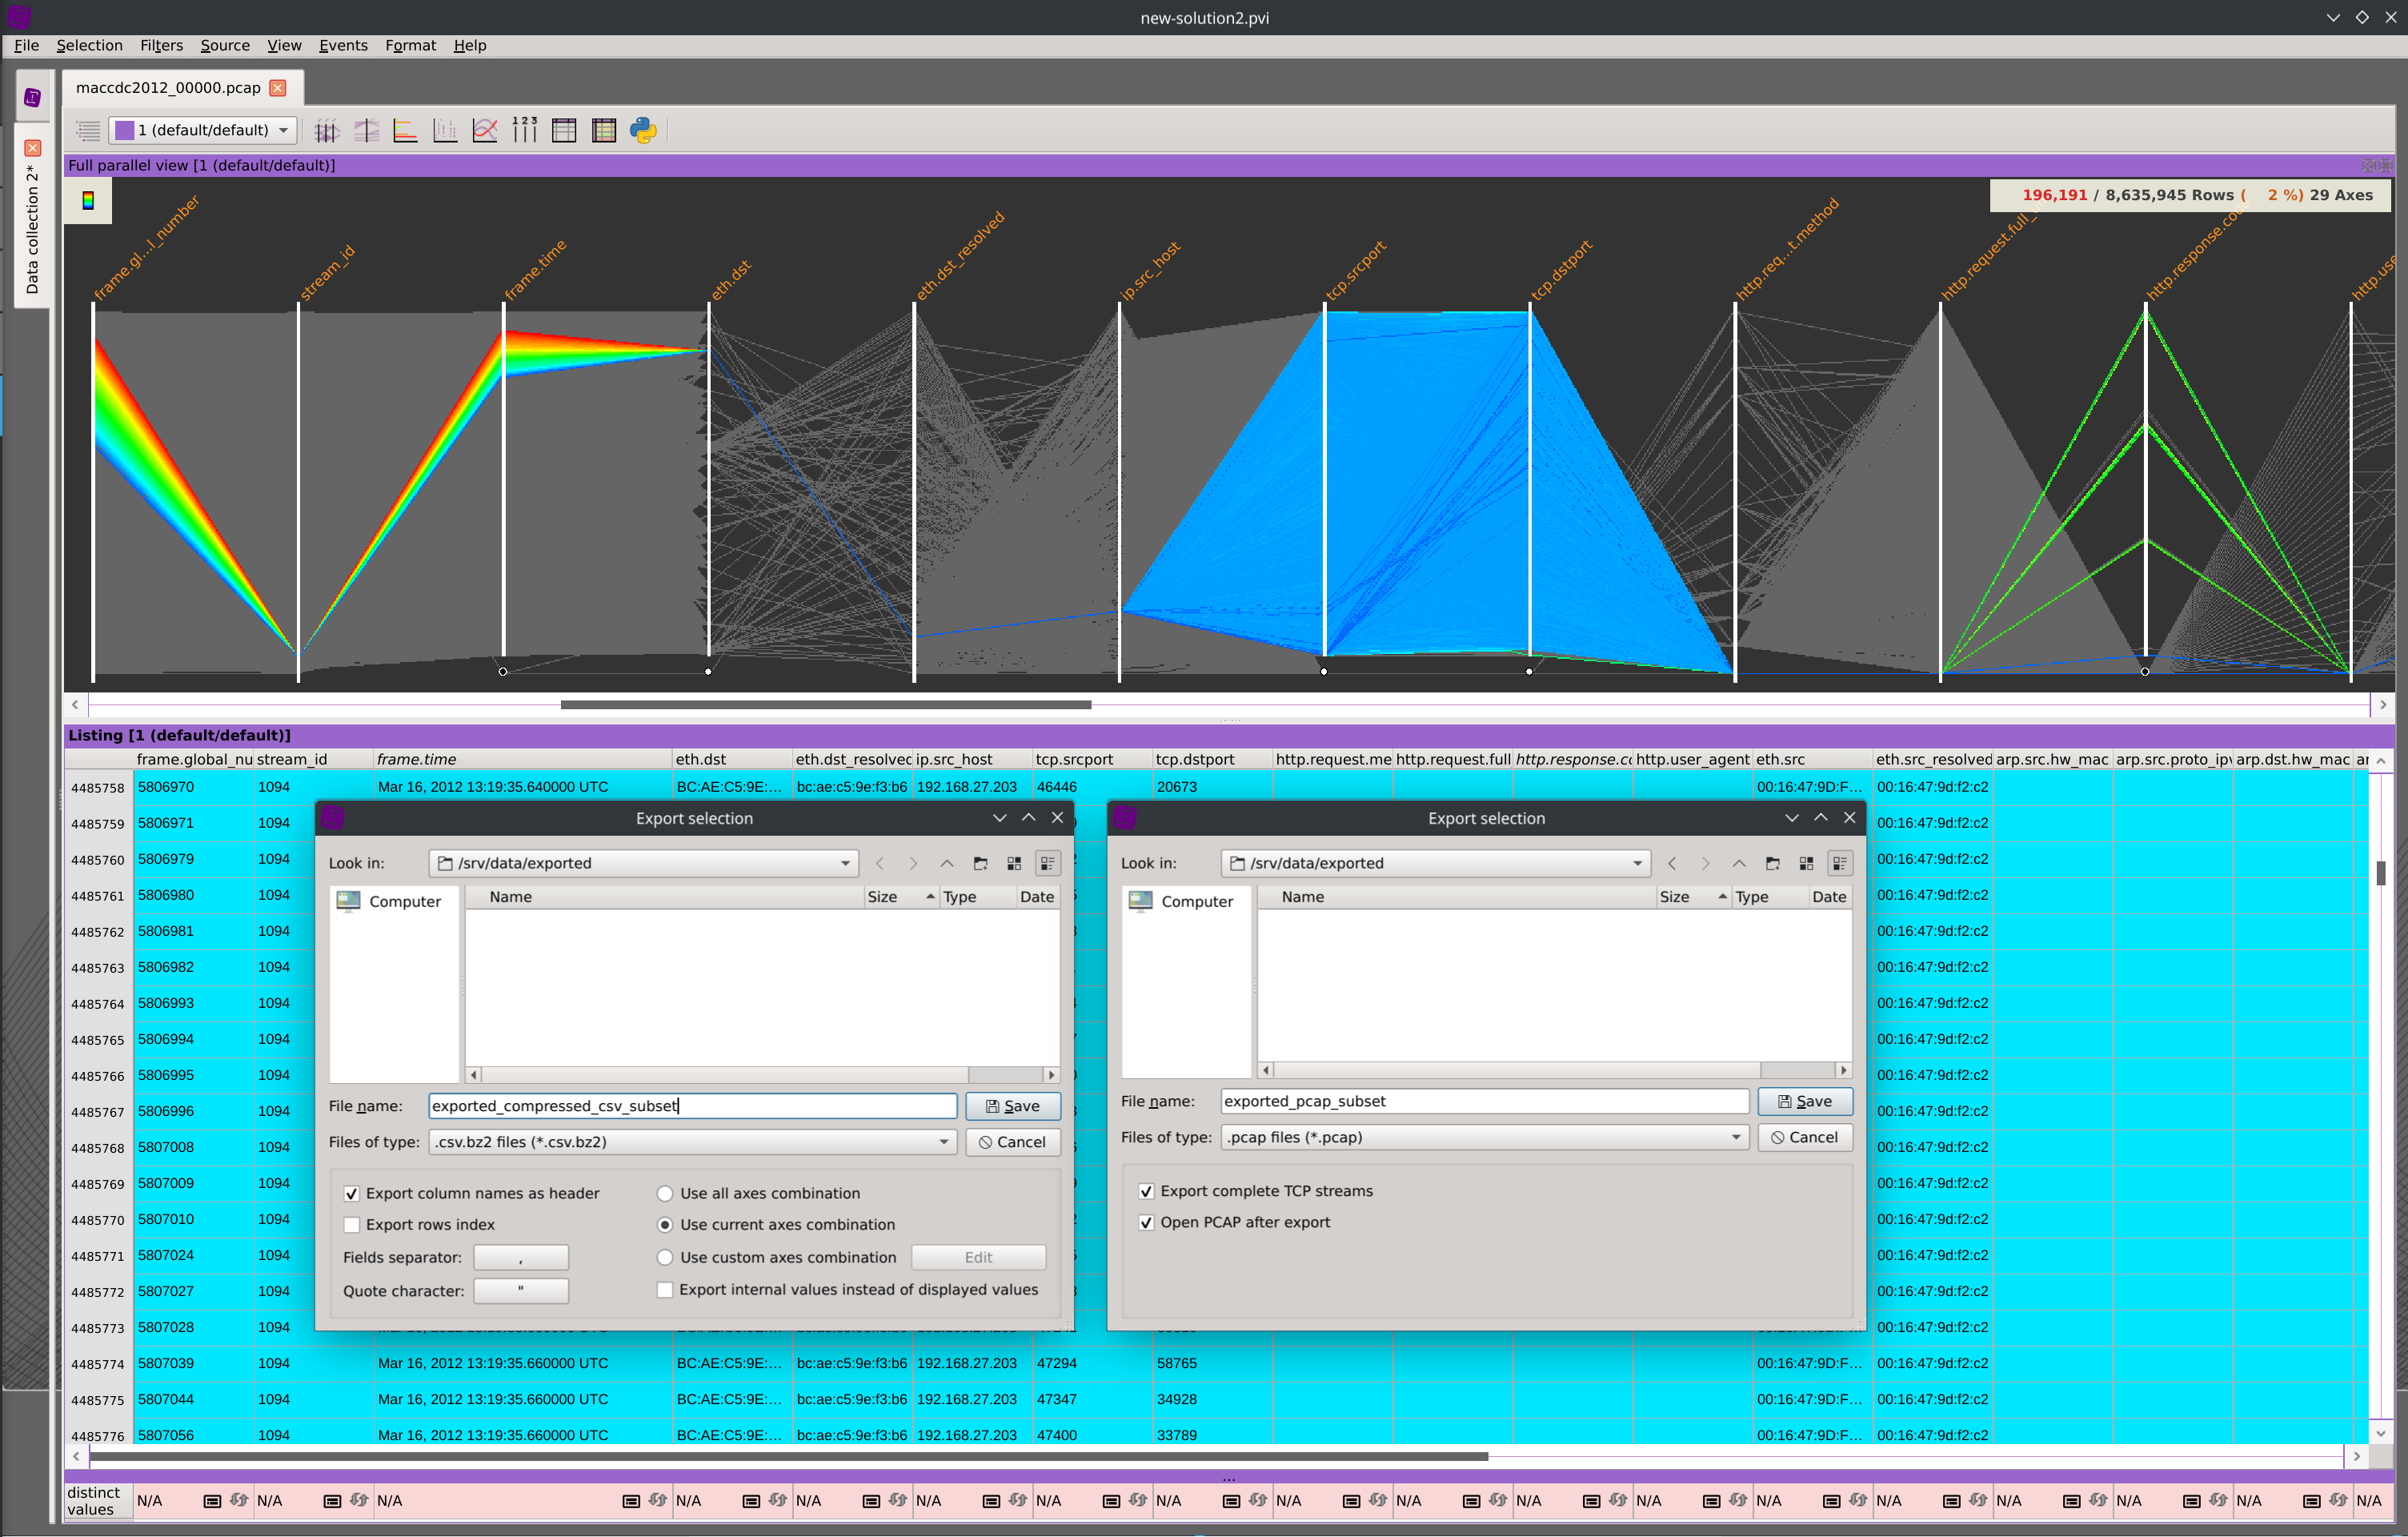
Once an interesting subset of data is isolated, easily export it as a CSV file for further analysis with other tools. Options to include headers, select specific columns, or compress data on-the-fly are available. Certain data source plugins may even offer exporting data in their original format with domain logic, allowing for exporting subsets of the original data (e.g., Parquet and PCAP files).
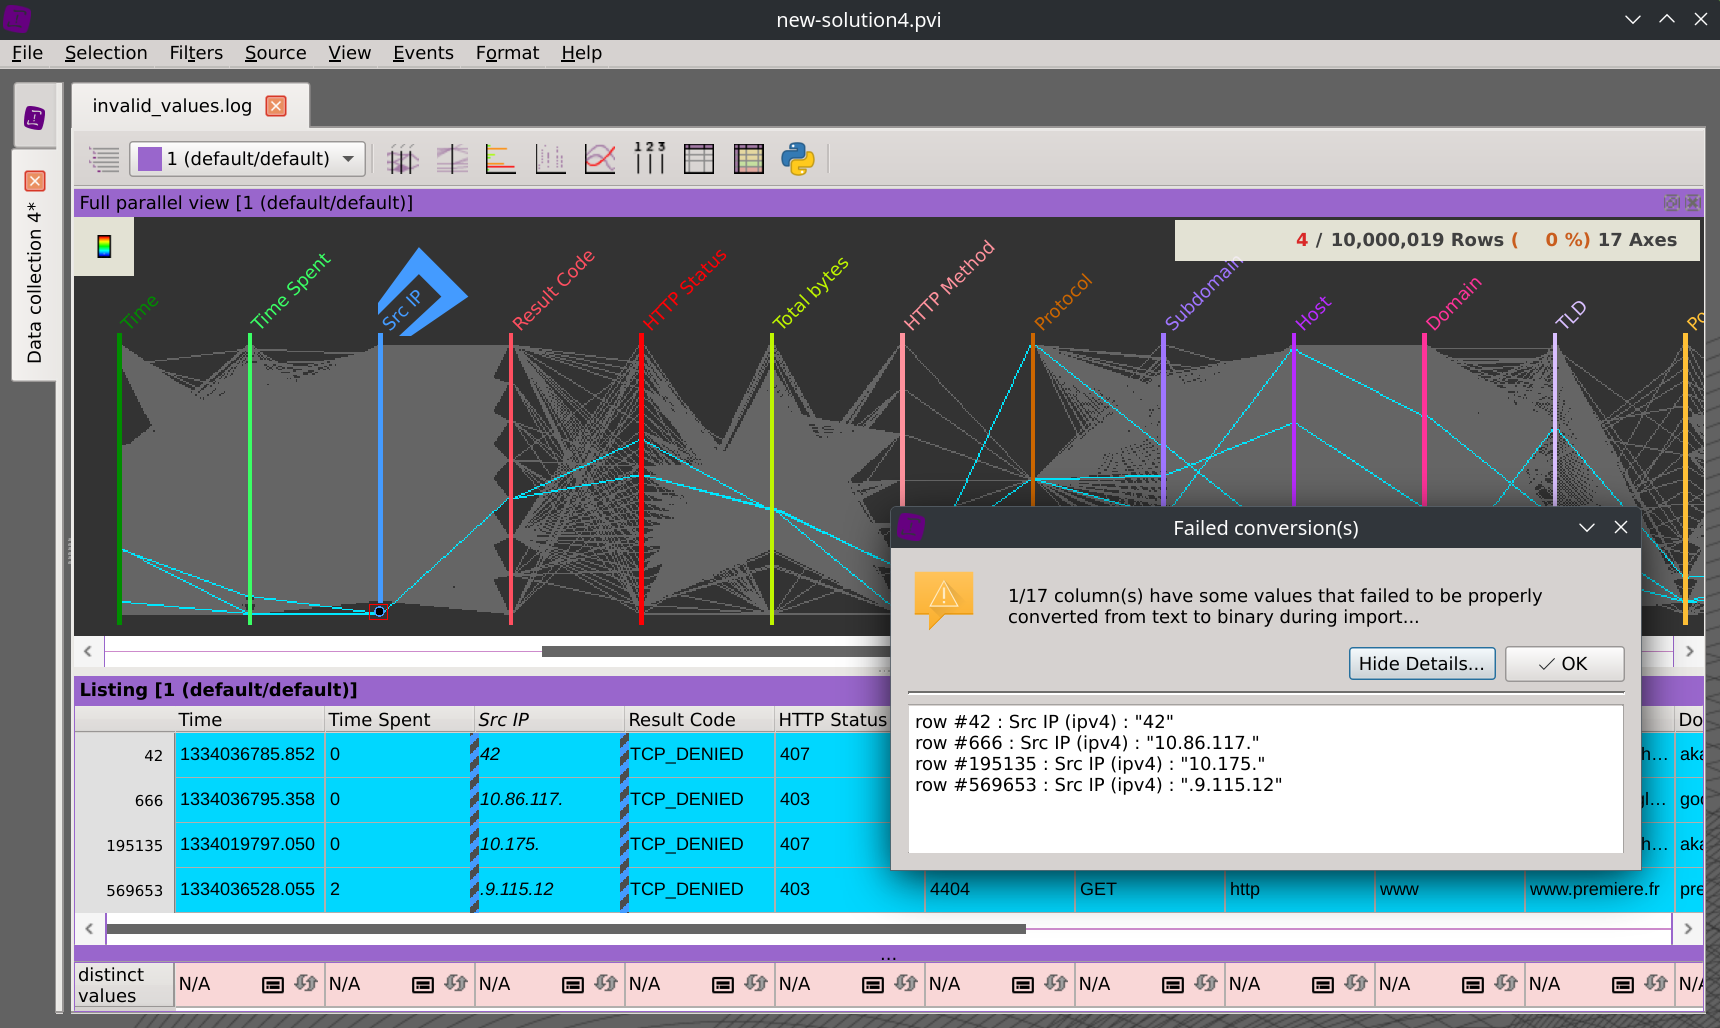
When encountering rows that don't conform to the expected format, they are not silently discarded. Instead, a warning dialog box is displayed, and you can access them at any time. This allows you to refine your data format in case of errors or fix input data. Similarly, values that don't match the expected data type are not discarded either. A warning message is displayed to identify them. These values are handled differently by each visualization (grouped at the bottom of the parallel coordinates axis or displayed in italics in the data listing, for example). This allows you to proceed with data analysis while being aware of such issues.
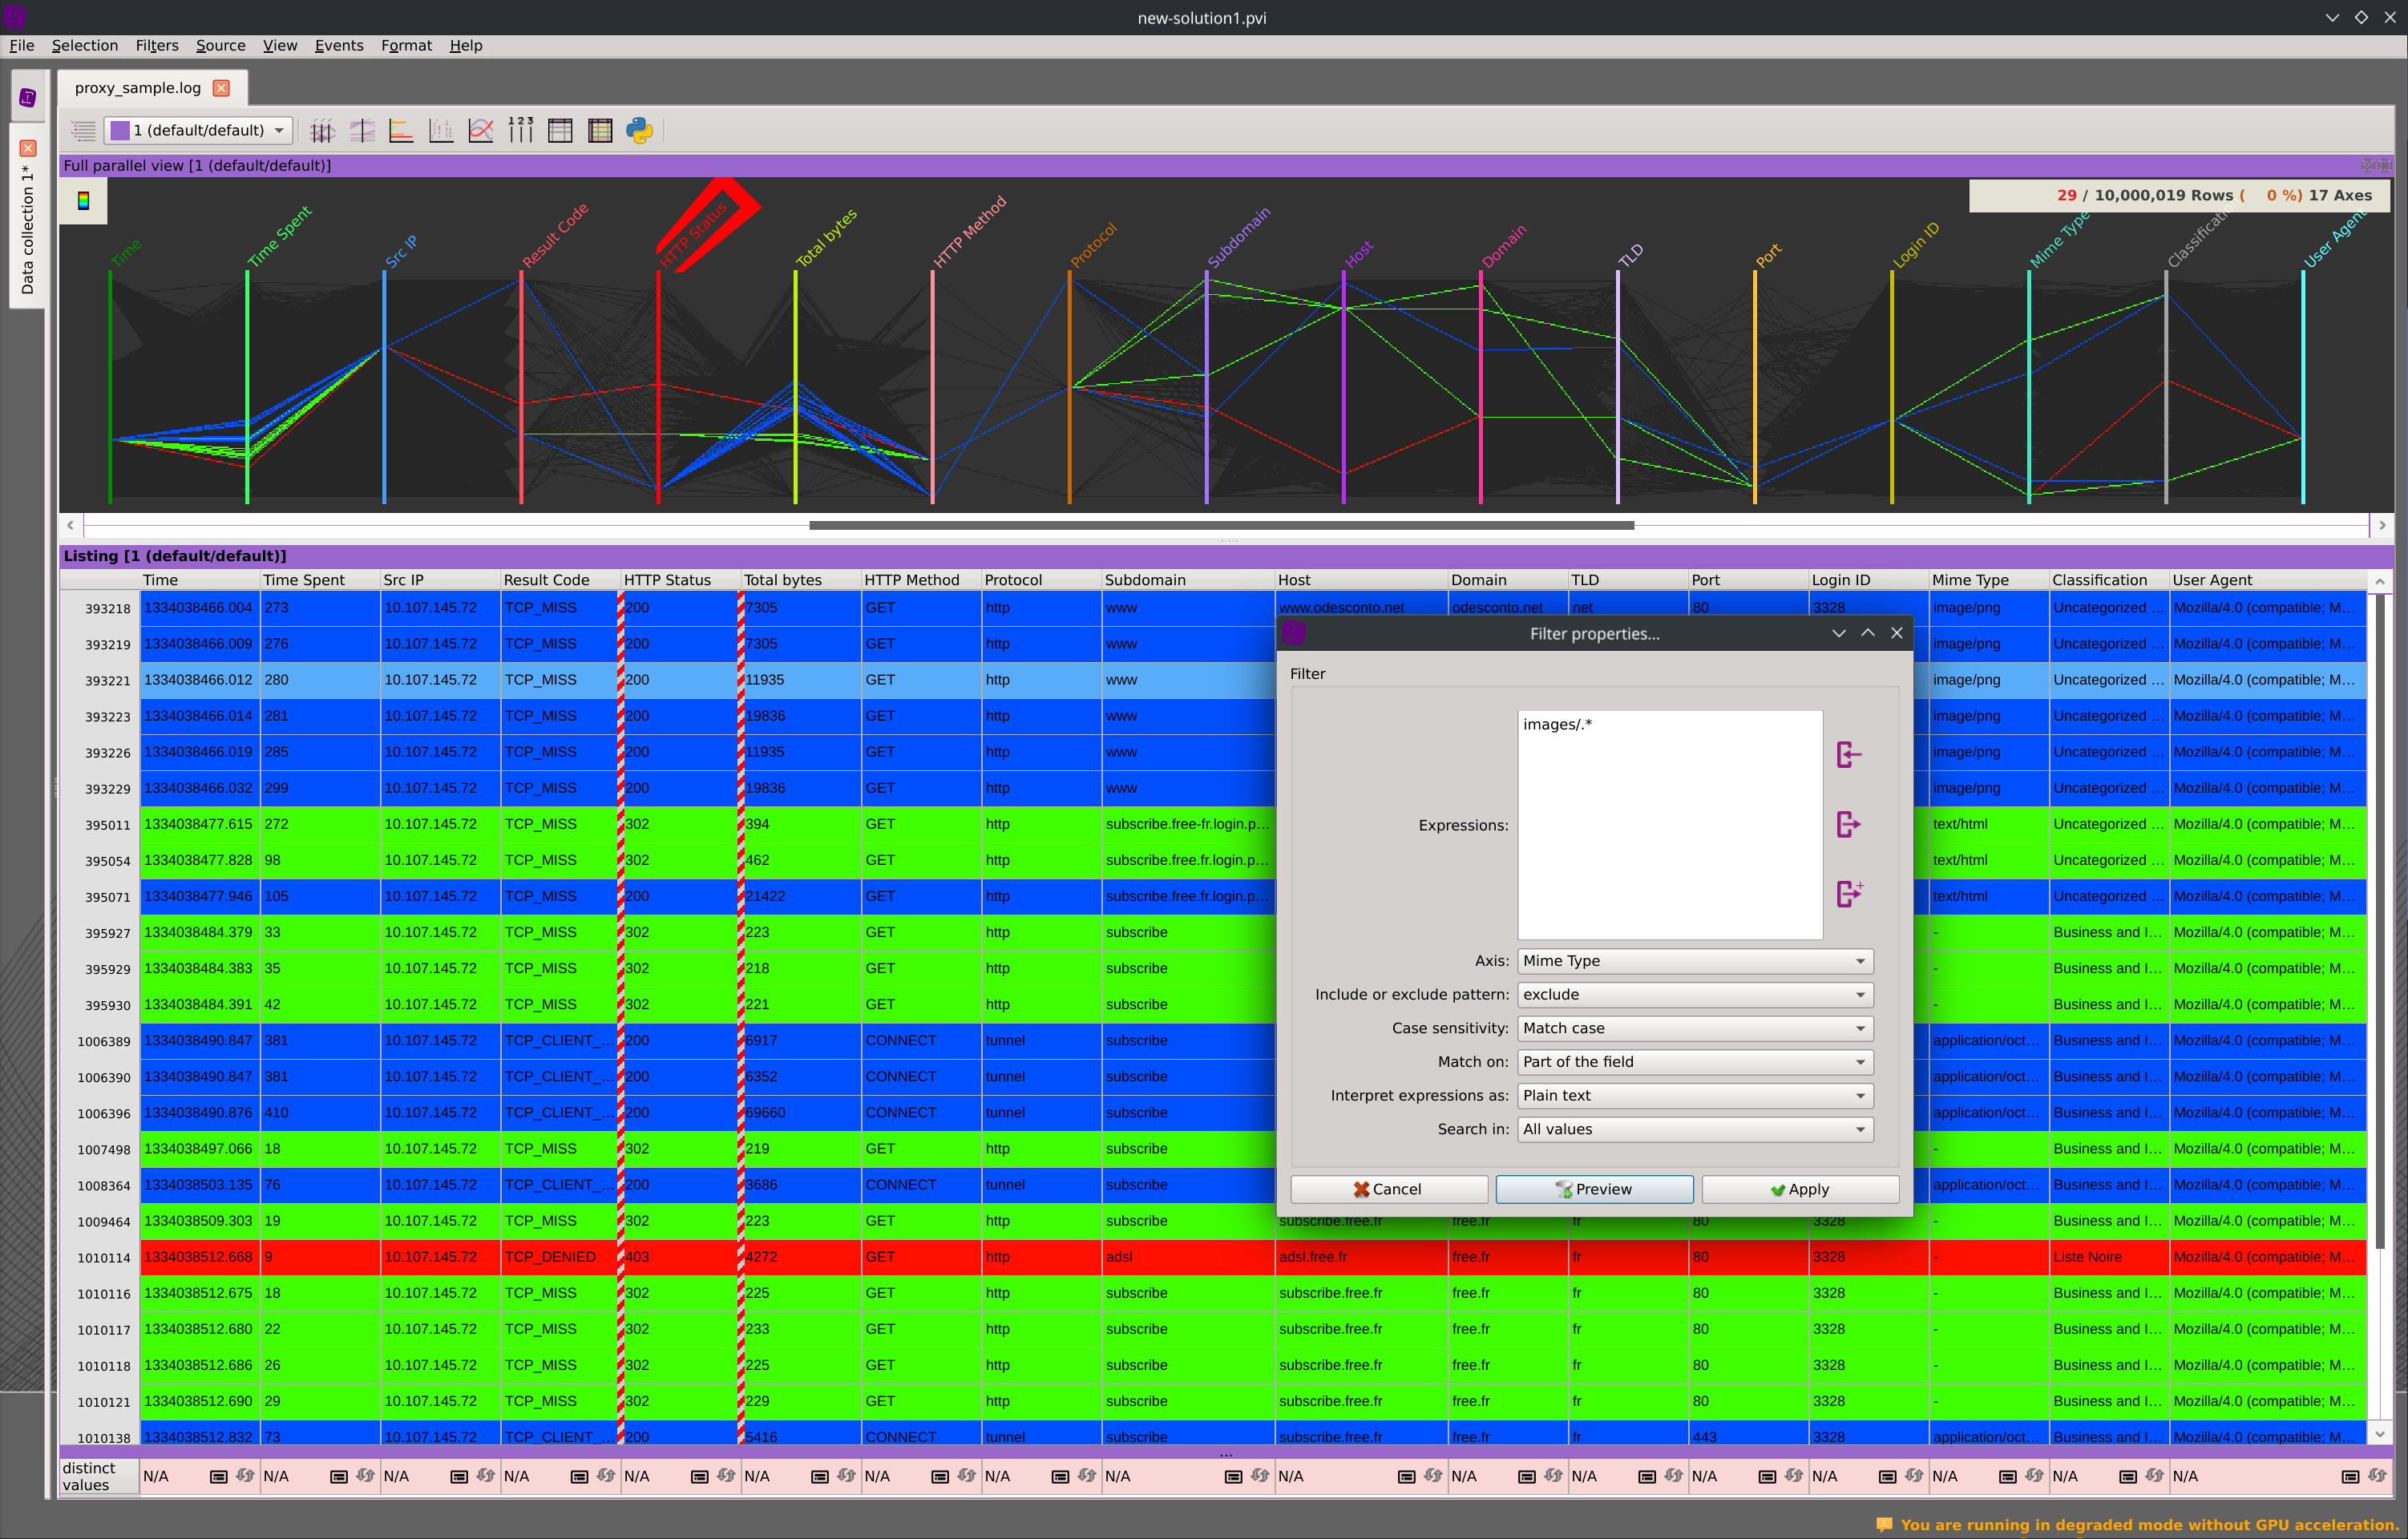
Apply filters successively (e.g., mouse selection, frequency filtering, or queries) across any dimension to narrow down your dataset and acquire a better understanding. All visualizations share a global selection model that enables them to act and react to the constantly changing filtering state. This let you switch seamlessly between capturing the big picture and focusing on the details.
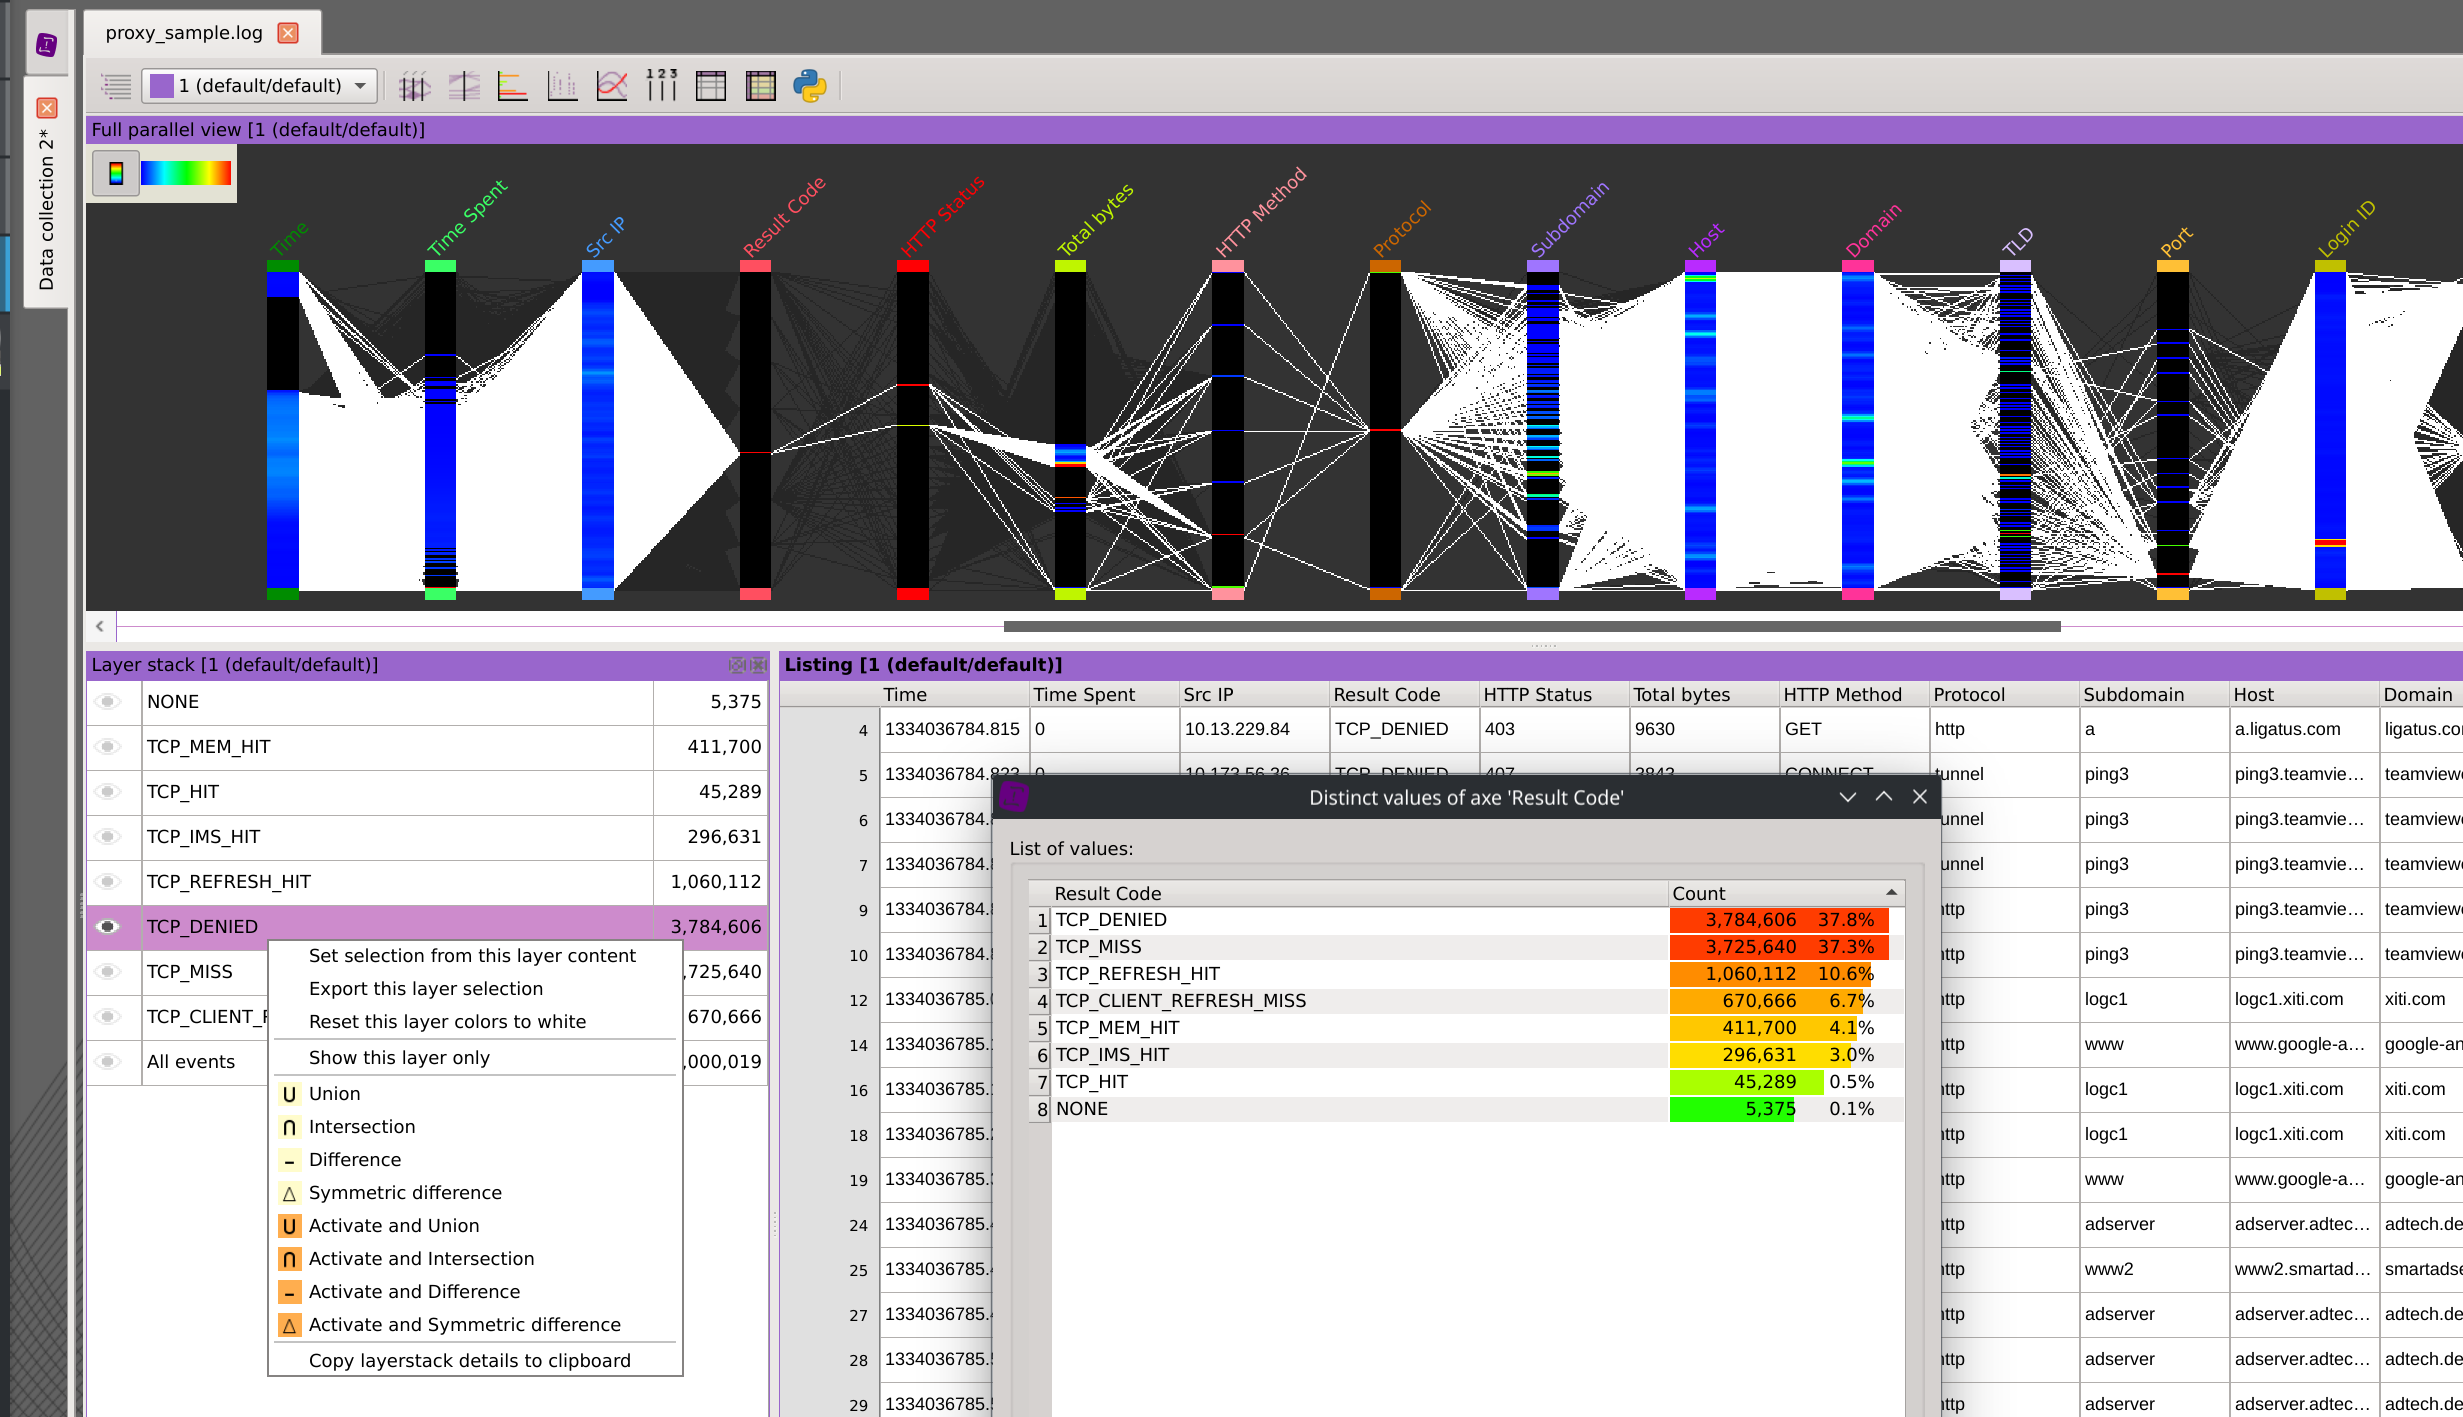
Layers are a convenient tool to apply an organized divide-and-conquer strategy over you dataset by grouping similar subsets without missing anything out.
Propagate selections between different data sources using a common variable as a pivot. This enables comprehensive data analysis involving datasets of different structures, providing valuable insights from complementary perspectives.
Squey is written in the latest C++ standard and leverages OpenMP and Intel Threading Building Blocks to accelerate any user actions.
Optimal visualization performances are achieved using a custom OpenCL/OpenGL rendering engine that supports CUDA.
The data storage and processing is implemented in a library as an in-process column-oriented hybrid database specially designed to efficiently handle ever-changing selections.
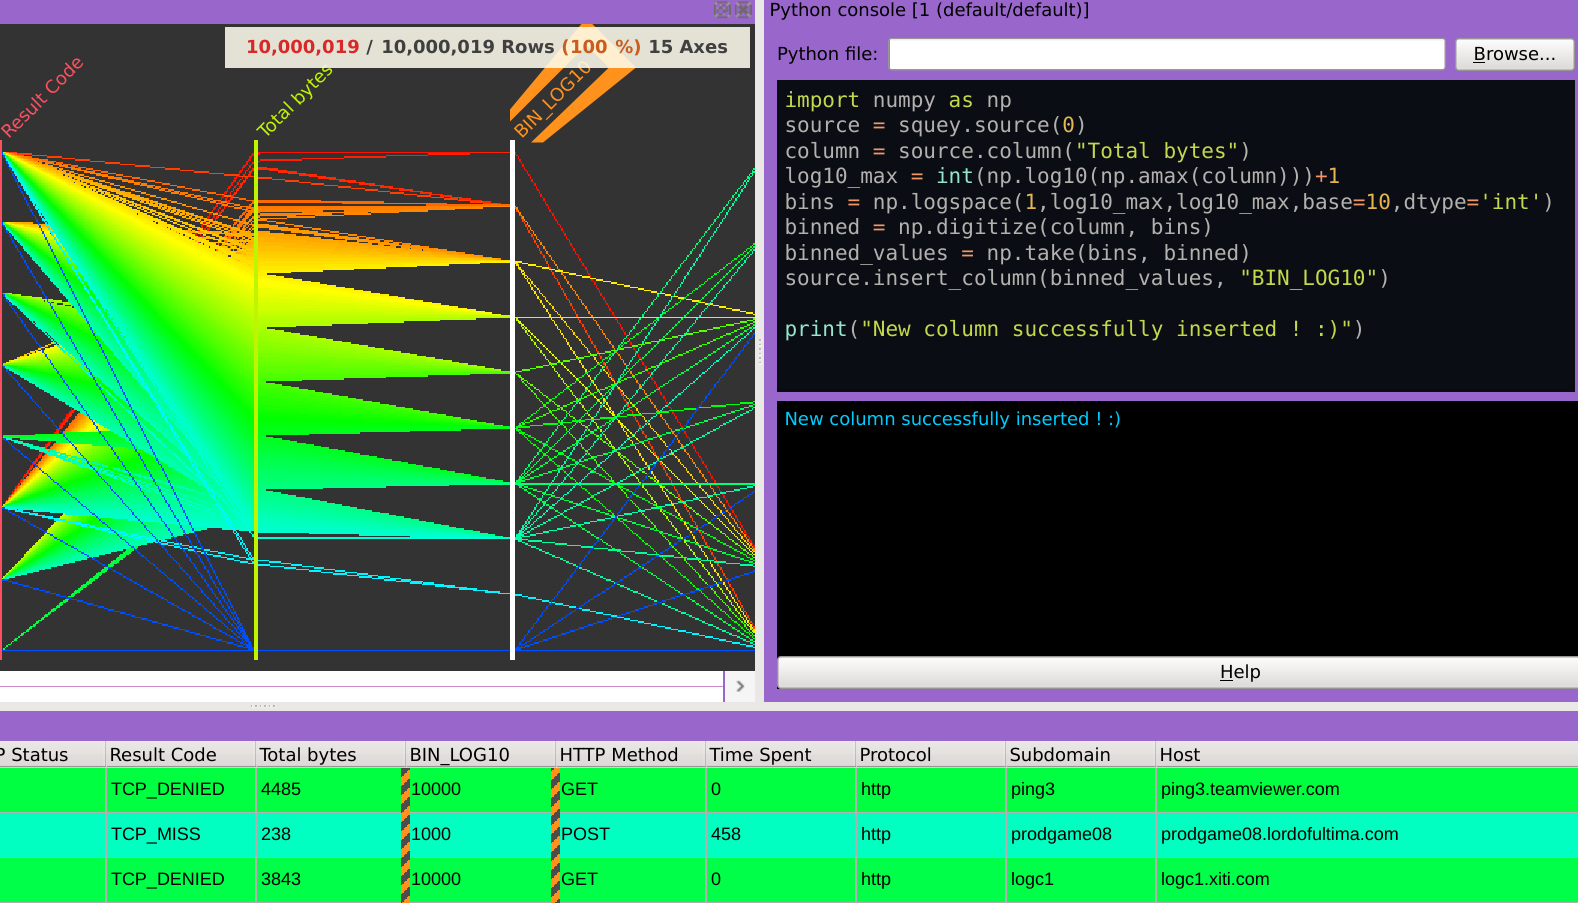
Columns are exposed to the Python scripting directly from the underlying data structure without any memory copy.

The Python scripting API allows the execution of arbitrary Python code during the software execution. It can manipulate the application state to create new columns, selections, or layers. Any Python package can be easily installed using the pip package installer available in the Flatpak container of the application. Moreover, the software architecture is modular and based on various types of plugins, including: 🗸 Input : Implements support for data sources 🗸 Ingest : Handles data manipulations during the data ingest phase 🗸 Filter : Implements custom dynamic filtering logics 🗸 Mapping, Plotting...
In May 2022, ESI Group in collaboration with ENSAM released this software as open source under the MIT license
Everyone is welcome to contribute !