Detect an SSH login after social engineering
Detect a compromised SSH account in one year of OpenSSH logs with Squey, spotting suspicious logins by time and location using parallel coordinates.
In this article, we are addressing the challenge presented by detecteam.com.
“We have published one year of ssh logins/logouts of a valid administrator; However the account has been compromised using social engineering similar to the MGM attack which led to a ransomware being deployed.” ― Detecteam
So here is the openssh.log_.zip (mirror) dataset and its associated openssh.log_.zip.format parsing file.
It’s looking like typical OpenSSH logs:
Sep 24 08:46:18 bidizidomo sshd[26168]: Accepted password for iworkinacasino from 173.194.42.31 port 63346 ssh2
Sep 24 08:46:18 bidizidomo sshd[26168]: pam_unix(sshd:session): session opened for user iworkinacasino(uid=1169) by (uid=0)
Sep 24 08:46:18 bidizidomo systemd-logind[515]: New session 8767 of user iworkinacasino.
Sep 24 08:46:18 bidizidomo sshd[26168]: pam_env(sshd:session): deprecated reading of user environment enabled
Sep 24 12:51:42 bidizidomo sshd[26971]: Received disconnect from 173.194.42.31 port 23568 disconnected by user
Sep 24 12:51:42 bidizidomo sshd[26971]: Disconnected from user iworkinacasino 173.194.42.31 port 23568
Sep 24 12:51:42 bidizidomo sshd[26971]: pam_unix(sshd:session): session closed for user iworkinacasino
Sep 24 14:32:41 bidizidomo sshd[44186]: Accepted password for iworkinacasino from 173.194.42.109 port 26603 ssh2
Sep 24 14:32:41 bidizidomo sshd[44186]: pam_unix(sshd:session): session opened for user iworkinacasino(uid=1169) by (uid=0)
...
During the data ingest step, the dataset was enriched in several ways:
- Two columns were added by splitting the
datetimecolumn in two, to separate thedateand thetime. - The column
countrywas computed thanks to the Python API by using the IPs for the lookup. - Columns not containing any relevant information were let aside (namely
userandservice) and rows that were not containing an IP address.
Here is the resulting dataset (containing 2230 rows and 7 columns) loaded in Squey:
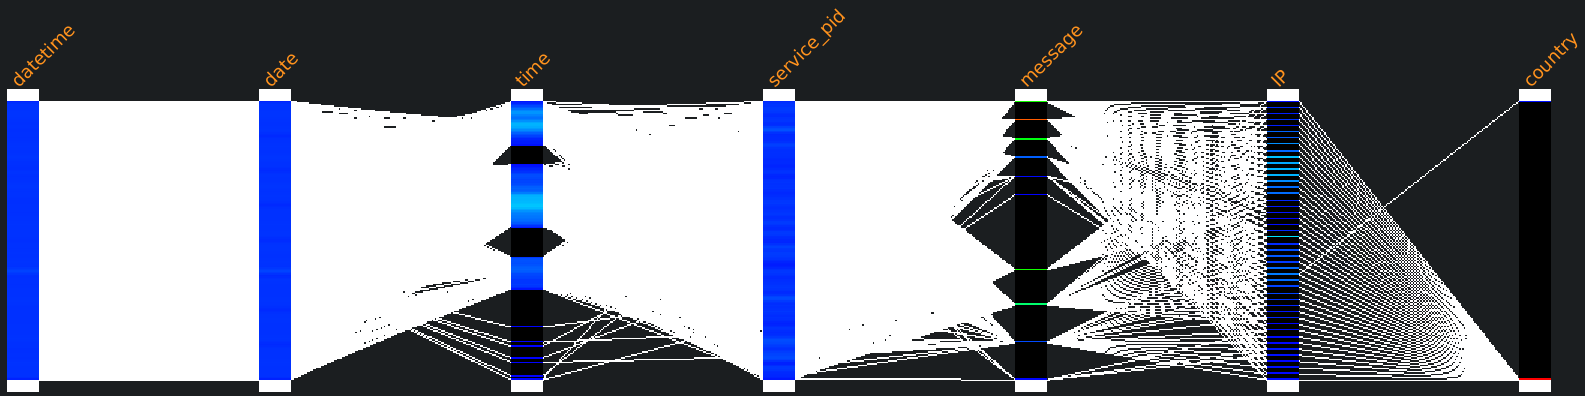
Having a time axis whose values are wrapped around 24h (00:00:00 at the bottom of the axis to 23:59:59 at the top) is very handy to observe the repartition of the connections during the day.
So except for the 7 wrong passwords that were supplied during the connections and the 7 during the reconnections, the connection pattern is disturbingly consistent, as every single day of the year unfolds as follows:
- start of the day : first connection from the US between 07:00 and 09:00
- lunch : deconnection and reconnection from the US between 10:56 and 14:58
- end of the day : deconnection between 16:12 and 19:01
But beyond this extreme conscistency, a particular network traffic visually stands out completely as the time and location of theses connections are totally contrasting:
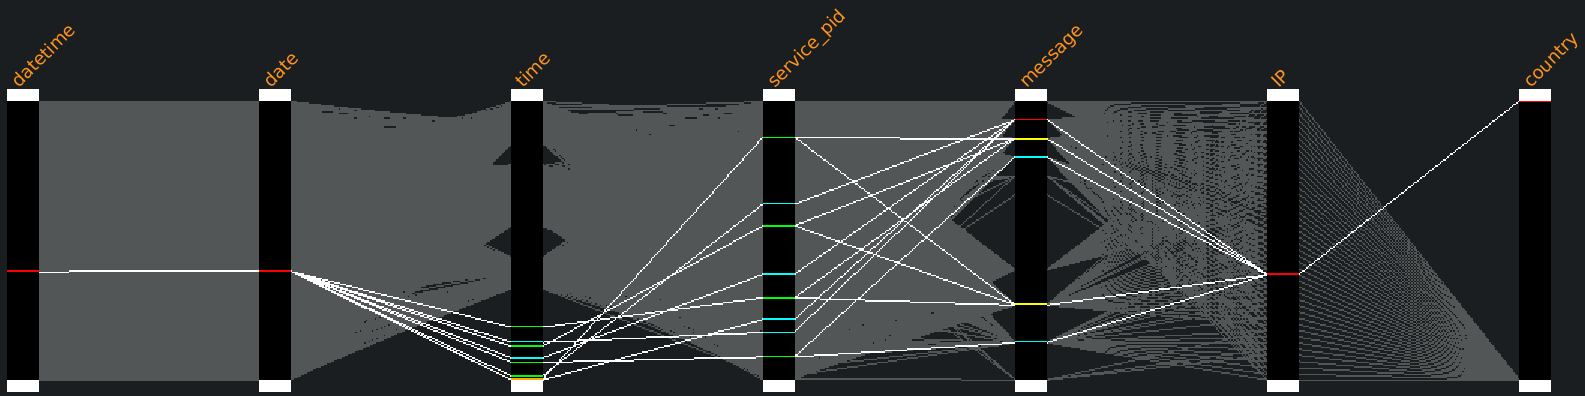
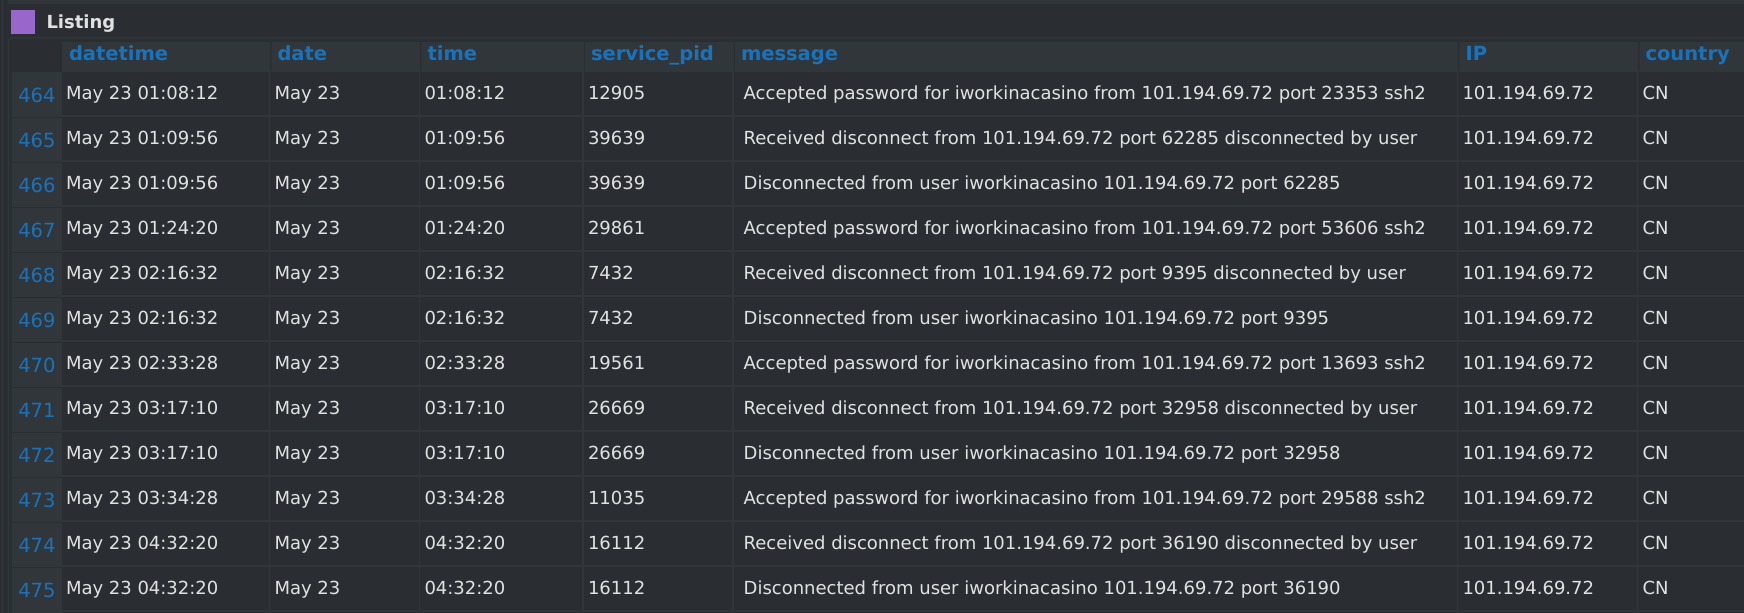
Indeed, four SSH connections were issued with success from China on May 23rd between 01:08:12 and 04:32:20 :
- at 01:18:12 (lasted 1m44s)
- at 01:24:20 (lasted 52m12s)
- at 02:33:28 (lasted 43m42s)
- at 03:34:28 (lasted 57m52s)
Although this dataset is extremely simple, it perfectly illustrates the importance of visually presenting data in an optimal fashion to highlight suspicious behaviors.
Creating the parsing file
For those interested in the way the parsing format file was created, here a quick step-by-step video tutorial.
Here are also the commands to install the required Python modules.
flatpak run --command=/app/bin/squey_sh org.squey.Squey
pip3 install python-geoip-python3 python-geoip-geolite2
As they are used by the following embedded Python script.
 1from geoip import geolite2
 2import numpy as np
 3def country(ip):
 4    return geolite2.lookup(ip).country
 5source = squey.source("openssh.log_.zip")
 6ips_column = source.column("IP")
 7unique_ips = np.unique(ips_column).tolist()
 8unique_countries = np.array(list(map(country, unique_ips)))
 9countries = np.array([unique_countries[unique_ips.index(ip)] for ip in ips_column])
10source.insert_column(countries, "country")